 RSS Feed
 by Calculated Risk on 3/31/2022 08:44:00 AM
Thursday, March 31, 2022
Personal Income increased 0.5% in February; Spending increased 0.2%
The BEA released the Personal Income and Outlays, February 2022:
Personal income increased $101.5 billion (0.5 percent) in February, according to estimates released today by the Bureau of Economic Analysis. Disposable personal income (DPI) increased $76.1 billion (0.4 percent) and personal consumption expenditures (PCE) increased $34.9 billion (0.2 percent).The February PCE price index increased 6.4 percent year-over-year and the November PCE price index, excluding food and energy, increased 5.4 percent year-over-year.
Real DPI decreased 0.2 percent in February and Real PCE decreased 0.4 percent; goods decreased 2.1 percent and services increased 0.6 percent. The PCE price index increased 0.6 percent. Excluding food and energy, the PCE price index increased 0.4 percent
emphasis added
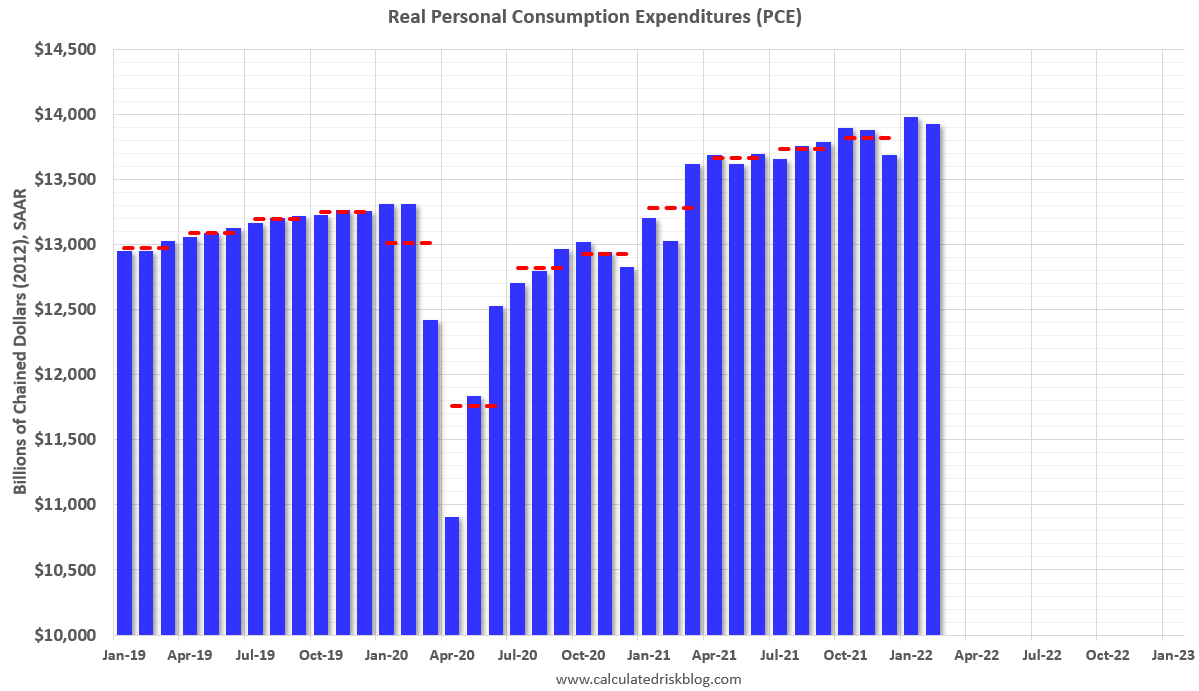
The following graph shows real Personal Consumption Expenditures (PCE) through February 2022 (2012 dollars). Note that the y-axis doesn't start at zero to better show the change.
 Click on graph for larger image.
The dashed red lines are the quarterly levels for real PCE.
Personal income was at expectations, and the increase in PCE was below expectations.
Using the two-month method to estimate Q1 PCE growth, PCE was increasing at a 1.9% annual rate in Q1 2022. (Using the mid-month method, PCE was increasing at 1.3%).
Weekly Initial Unemployment Claims Increase to 202,000
by Calculated Risk on 3/31/2022 08:33:00 AM
The DOL reported:
In the week ending March 26, the advance figure for seasonally adjusted initial claims was 202,000, an increase of 14,000 from the previous week's revised level. The previous week's level was revised up by 1,000 from 187,000 to 188,000. The 4-week moving average was 208,500, a decrease of 3,500 from the previous week's revised average. The previous week's average was revised up by 250 from 211,750 to 212,000.The following graph shows the 4-week moving average of weekly claims since 1971.
emphasis added
 Click on graph for larger image.
The dashed line on the graph is the current 4-week average. The four-week average of weekly unemployment claims decreased to 208,500.
The previous week was revised up.
Weekly claims were slightly above the consensus forecast.
Wednesday, March 30, 2022
Thursday: Personal Income and Outlays, Unemployment Claims
by Calculated Risk on 3/30/2022 08:56:00 PM
Thursday:
• At 8:30 AM ET, The initial weekly unemployment claims report will be released. The consensus is for an increase to 195 thousand from 187 thousand last week.
• Also at 8:30 AM, Personal Income and Outlays for February. The consensus is for a 0.5% increase in personal income, and for a 0.5% increase in personal spending. And for the Core PCE price index to increase 0.4%.
• At 9:45 AM, Chicago Purchasing Managers Index for March. The consensus is for a reading of 56.6, up from 56.3 in February.
On COVID (focus on hospitalizations and deaths):
| COVID Metrics | ||||
|---|---|---|---|---|
| Now | Week Ago | Goal | ||
| Percent fully Vaccinated | 65.5% | --- | ≥70.0%1 | |
| Fully Vaccinated (millions) | 217.6 | --- | ≥2321 | |
| New Cases per Day3 | 25,218 | 26,682 | ≤5,0002 | |
| Hospitalized3 | 12,625 | 16,043 | ≤3,0002 | |
| Deaths per Day3 | 644 | 755 | ≤502 | |
| 1 Minimum to achieve "herd immunity" (estimated between 70% and 85%). 2my goals to stop daily posts, 37-day average for Cases, Currently Hospitalized, and Deaths 🚩 Increasing 7-day average week-over-week for Cases, Hospitalized, and Deaths ✅ Goal met. | ||||
 Click on graph for larger image.
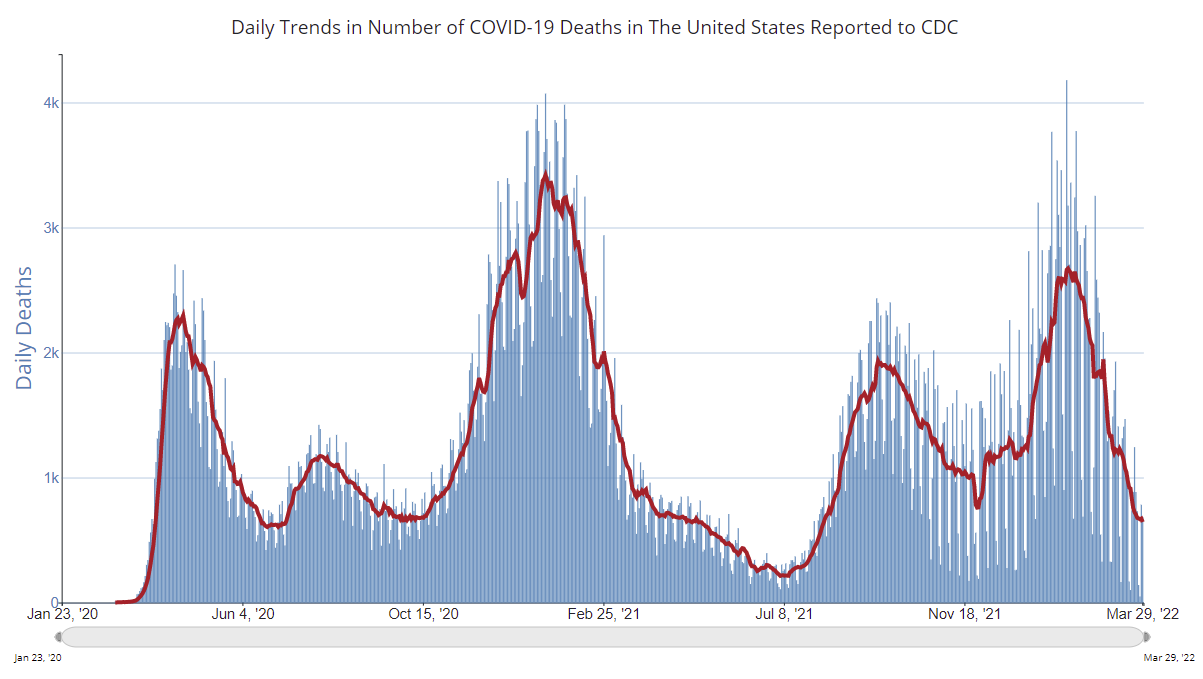
This graph shows the daily (columns) and 7-day average (line) of deaths reported.
Las Vegas February 2022: Visitor Traffic Down 18% Compared to 2019
by Calculated Risk on 3/30/2022 02:21:00 PM
From the Las Vegas Visitor Authority: February 2022 Las Vegas Visitor Statistics
Despite continued waning effects of the Omicron variant during the month, Las Vegas visitation exceeded 2.6M in February, 70% ahead of a year ago but down ‐18% vs. February 2019.
Overall hotel occupancy reached 69.3%, roughly 10 pts ahead of January, up 27.3 pts YoY and down 17.7 pts vs. February 2019. Weekend occupancy came in relatively strong at 87.5%, 24.7 pts ahead of the weekend levels of last February and only 4.4 pts below February 2019. Midweek occupancy still reflected a convention segment in recovery but reached 60.7%, well over the 32.1% level of last February (+28.6 pts) but down 23.9 pts vs. February 2019.
February 2022 ADR approached $150, surpassing both February 2021 (+52.5%) and February 2019 (+15.0%) while RevPAR reached $103.62 for the month, dramatically ahead of February 2021 (+151.7%) and down only 8.4% vs. February 2019.
 Click on graph for larger image.
 The first graph shows visitor traffic for 2019 (dark blue), 2020 (light blue), 2021 (yellow) and 2022 (red)
Visitor traffic was down 18.0% compared to the same month in 2019.
Visitor was up 70% compared to last January.
The second graph shows convention traffic.
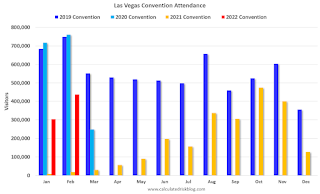
Convention traffic was down 41.4% compared to January 2019.The second graph shows convention traffic.

Note: There was almost no convention traffic from April 2020 through May 2021.
Real House Prices, Price-to-Rent Ratio and Price-to-Median Income in January and a look at "Affordability"
by Calculated Risk on 3/30/2022 11:04:00 AM
Today, in the Calculated Risk Real Estate Newsletter: Real House Prices, Price-to-Rent Ratio and Price-to-Median Income in January
Excerpt:
I’ve put together my own affordability index - since 1976 - that is similar to the FirstAm approach (more of a house price index adjusted by mortgage rates and the median household income).
I used median income from the Census Bureau (estimated 2021), assumed a 15% down payment, and used a 2% estimate for property taxes, insurance and maintenance. This is probably low for high property tax states like New Jersey and Texas, and too high for lower property tax states. If we were including condos, we’d also include HOA fees too (this is excluded).
For house prices, I used the Case-Shiller National Index, Seasonally Adjusted (SA). Also, for the down payment - there wasn’t a significant difference between 15% and 20%. For mortgage rates, I used the Freddie Mac PMMS (30-year fixed rates).
So here is what the index looks like (lower is more affordable like the FirstAm index):
Note that by this index, during the early ‘80s, homes were very unaffordable due to the very high mortgage rates. During the housing bubble, houses were also less affordable using 30-year mortgage rates, however, during the bubble, there were many “affordability products” that allowed borrowers to be qualified at the teaser rate (usually around 1%) that made houses seem more affordable.
In general, this would suggest houses are the least affordable since the housing bubble. This says nothing about if “now is a good time to buy” (see the bottom of my post Housing: A Look at "Affordability" Indexes).
Also, in January, the average 30-year mortgage rates were around 3.45%, and currently mortgage rates are close to 4.9% - so we already know the “Affordability Price Index” will increase sharply over the next couple of months (meaning houses are even less affordable).

There is much more in the article. You can subscribe at https://calculatedrisk.substack.com/
Q4 GDP Growth Revised down to 6.9% Annual Rate
by Calculated Risk on 3/30/2022 08:36:00 AM
From the BEA: Gross Domestic Product (Third Estimate), Corporate Profits, and GDP by Industry, Fourth Quarter and Year 2021
Real gross domestic product (GDP) increased at an annual rate of 6.9 percent in the fourth quarter of 2021, according to the "third" estimate released by the Bureau of Economic Analysis. In the third quarter, real GDP increased 2.3 percent.Here is a Comparison of Third and Second Estimates. PCE growth was revised down from 3.1% to 2.5%. Residential investment was revised up from 1.0% to 2.2%.
The "third" estimate of GDP released today is based on more complete source data than were available for the "second" estimate issued last month. In the second estimate, the increase in real GDP was 7.0 percent. The downward revision primarily reflected downward revisions to personal consumption expenditures (PCE) and exports that were partly offset by an upward revision to private inventory investment.
emphasis added
ADP: Private Employment Increased 455,000 in March
by Calculated Risk on 3/30/2022 08:22:00 AM
Private sector employment increased by 455,000 jobs from February to March according to the March ADP® National Employment ReportTM. Broadly distributed to the public each month, free of charge, the ADP National Employment Report is produced by the ADP Research Institute® in collaboration with Moody’s Analytics. The report, which is derived from ADP’s actual data of those who are on a company’s payroll, measures the change in total nonfarm private employment each month on a seasonally-adjusted basisThis was slightly above the consensus forecast of 438,000 for this report.
“Job growth was broad-based across sectors in March, contributing to the nearly 1.5 million jobs added for the first quarter in 2022,” said Nela Richardson, chief economist, ADP. “Businesses are hiring, specifically among the service providers which had the most ground to make up due to early pandemic losses. However, a tight labor supply remains an obstacle for continued growth in consumer-facing industries
emphasis added
The BLS report will be released Friday, and the consensus is for 475 thousand non-farm payroll jobs added in March. The ADP report has not been very useful in predicting the BLS report, but this suggests a solid March BLS report.
MBA: Mortgage Applications Decrease in Latest Weekly Survey
by Calculated Risk on 3/30/2022 07:00:00 AM
From the MBA: Mortgage Applications Decrease in Latest MBA Weekly Survey
Mortgage applications decreased 6.8 percent from one week earlier, according to data from the Mortgage Bankers Association’s (MBA) Weekly Mortgage Applications Survey for the week ending March 25, 2022.
... The Refinance Index decreased 15 percent from the previous week and was 60 percent lower than the same week one year ago. The seasonally adjusted Purchase Index increased 1 percent from one week earlier. The unadjusted Purchase Index increased 1 percent compared with the previous week and was 10 percent lower than the same week one year ago.
“Mortgage rates jumped to their highest level in more than three years last week, as investors continue to price in the impact of a more restrictive monetary policy from the Federal Reserve. Not surprisingly, refinance application volume declined further, as fewer borrowers have an incentive to apply at rates that are significantly higher than a year ago. Refinance application volume is now 60 percent below last year’s levels, in line with MBA’s forecast for 2022,” said Mike Fratantoni, MBA Senior Vice President and Chief Economist. “Even with the ongoing climb in rates, purchase application volumes were little changed last week. This is particularly auspicious, as we are now in the beginning of the spring homebuying season, and those shopping for homes are struggling with not only higher and more volatile mortgage rates, but also an ongoing shortage of homes on the market. Given these hurdles, it appears to be promising news that purchase application volume has not declined, as many potential buyers are likely feeling the squeeze in their purchasing power from the jump in rates.”
...
The average contract interest rate for 30-year fixed-rate mortgages with conforming loan balances ($647,200 or less) increased to 4.80 percent from 4.50 percent, with points decreasing to 0.56 from 0.59 (including the origination fee) for 80 percent loan-to-value ratio (LTV) loans.
emphasis added
 Click on graph for larger image.
The first graph shows the refinance index since 1990.
With higher mortgage rates, the refinance index has declined sharply over the last several months.
The refinance index is at the lowest level since May 2019.
The second graph shows the MBA mortgage purchase index
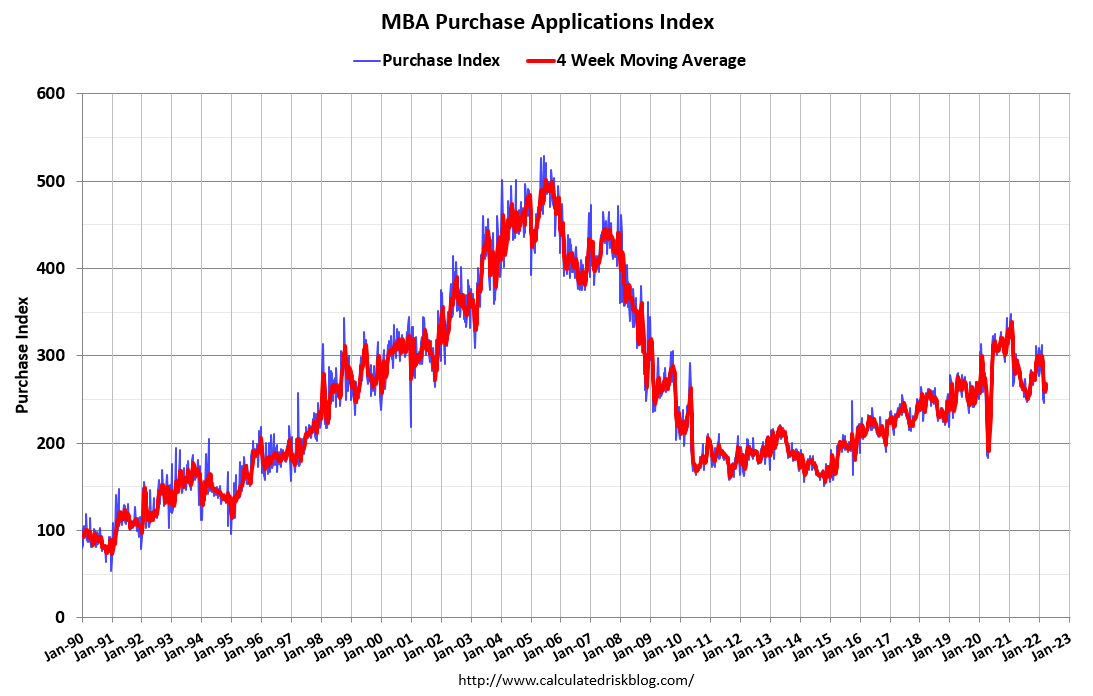 According to the MBA, purchase activity is down 10% year-over-year unadjusted.
Note: Red is a four-week average (blue is weekly).
Tuesday, March 29, 2022
Wednesday: GDP, ADP Employment
by Calculated Risk on 3/29/2022 09:01:00 PM
Wednesday:
• At 7:00 AM ET, The Mortgage Bankers Association (MBA) will release the results for the mortgage purchase applications index.
• At 8:15 AM, The ADP Employment Report for March. This report is for private payrolls only (no government). The consensus is for 438,000 payroll jobs added in March, down from 475,000 added in February.
• At 8:30 AM, Gross Domestic Product, 4th quarter 2021 (Third estimate). The consensus is that real GDP increased 7.1% annualized in Q4.
On COVID (focus on hospitalizations and deaths):
| COVID Metrics | ||||
|---|---|---|---|---|
| Now | Week Ago | Goal | ||
| Percent fully Vaccinated | 65.5% | --- | ≥70.0%1 | |
| Fully Vaccinated (millions) | 217.5 | --- | ≥2321 | |
| New Cases per Day3 | 26,190 | 27,282 | ≤5,0002 | |
| Hospitalized3 | 12,934 | 16,599 | ≤3,0002 | |
| Deaths per Day3 | 700 | 862 | ≤502 | |
| 1 Minimum to achieve "herd immunity" (estimated between 70% and 85%). 2my goals to stop daily posts, 37-day average for Cases, Currently Hospitalized, and Deaths 🚩 Increasing 7-day average week-over-week for Cases, Hospitalized, and Deaths ✅ Goal met. | ||||
 Click on graph for larger image.
This graph shows the daily (columns) and 7-day average (line) of deaths reported.
Mortgage Rates Ease Slightly
by Calculated Risk on 3/29/2022 05:21:00 PM
From Matthew Graham at MortgageNewsDaily: Here We Go Again: Mortgage Rates Making Another Recovery Attempt
Now today, we have another improvement in the bond market that looks quite similar to the one seen last week. This one arose due to hopes for some sort of de-escalation in Ukraine. The thought process is that de-escalation helps oil prices drop, thus easing upward pressure on inflation and allowing the Fed to be slightly less aggressive in making policy changes that are unfriendly to rates.
If recent instances of hope and the subsequent crushing of those hopes are any guide, this could certainly be another head fake. There's no way to tell how likely that is. What we can say is that it would take several more days with bigger improvements to alter the broader rising rate trend.
The average lender was closest to 5.0% on Friday and Monday for top tier conventional 30yr fixed scenarios. Today's number is closer to 4.875% for the same scenarios.
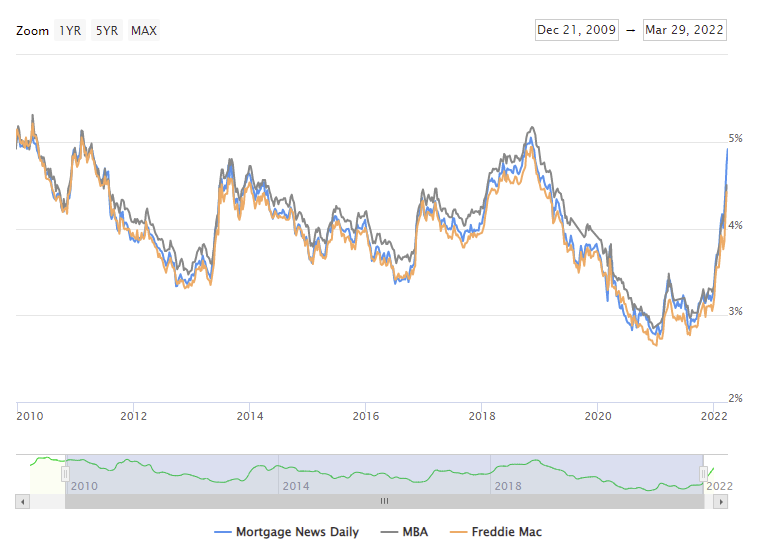 Click on graph for larger image.
This is a graph from Mortgage News Daily (MND) showing 30-year fixed rates from three sources (MND, MBA, Freddie Mac) since 2010.
The 30-year fixed rate for top tier scenarios was 4.88% today, down from 4.95% on Monday.
Go to MND and you can adjust the graph for different time periods.


