 RSS Feed
 by Calculated Risk on 1/23/2022 06:56:00 PM
Sunday, January 23, 2022
Sunday Night Futures
Weekend:
• Schedule for Week of January 23, 2022
• FOMC Preview: Final Asset Purchase Announcement Expected; Hints at "Liftoff" in March
Monday:
• At 8:30 AM ET, Chicago Fed National Activity Index for December. This is a composite index of other data.
From CNBC: Pre-Market Data and Bloomberg futures S&P 500 futures are up 19 and DOW futures are up 106 (fair value).
Oil prices were up over the last week with WTI futures at $85.14 per barrel and Brent at $87.89 per barrel. A year ago, WTI was at $53, and Brent was at $55 - so WTI oil prices are up about 60% year-over-year.
Here is a graph from Gasbuddy.com for nationwide gasoline prices. Nationally prices are at $3.29 per gallon. A year ago prices were at $2.39 per gallon, so gasoline prices are up $0.90 per gallon year-over-year.
FOMC Preview: Final Asset Purchase Announcement Expected; Hints at "Liftoff" in March
by Calculated Risk on 1/23/2022 10:46:00 AM
Expectations are the FOMC will announce their final asset purchases at the meeting this week.
There might be some economic weakness in the first couple months of 2022 related to the pandemic, but the FOMC appears poised to look through that weakness.
From Merrill Lynch:
In November, the FOMC started to taper their purchases. The FOMC announced a reduction in their purchases to "at least $70 billion" Treasury securities per month and of "at least $35 billion" agency MBS per month. They also announced a further reduction in December to "at least $60 billion" Treasury securities per month and of "at least $30 billion" agency MBS per month.
In December, the FOMC announced an acceleration in the taper, and reduced their purchases to "at least $40 billion" Treasury securities per month and of "at least $20 billion" agency MBS per month starting in January. A similar reduction in asset purchases in February (to $20 billion in Treasury securities and $10 billion in agency MBS) seems likely - and that would be the final asset purchases.
From Merrill Lynch:
"The Fed will announce the last round of asset purchases at the January FOMC meeting, which is well anticipated. We believe Chair Powell could continue to pivot hawkishly during the press conference."From Goldman Sachs:
"The FOMC is likely to use its January meeting next week to hint at a March liftoff and to begin formulating a plan for balance sheet reduction. We expect the FOMC to raise interest rates four times this year starting in March and to announce the start of balance sheet reduction in July."For review, for most of last year the FOMC was purchasing "at least $80 billion" Treasury securities per month and "at least $40 billion" agency mortgage‑backed securities (MBS) per month.
In November, the FOMC started to taper their purchases. The FOMC announced a reduction in their purchases to "at least $70 billion" Treasury securities per month and of "at least $35 billion" agency MBS per month. They also announced a further reduction in December to "at least $60 billion" Treasury securities per month and of "at least $30 billion" agency MBS per month.
In December, the FOMC announced an acceleration in the taper, and reduced their purchases to "at least $40 billion" Treasury securities per month and of "at least $20 billion" agency MBS per month starting in January. A similar reduction in asset purchases in February (to $20 billion in Treasury securities and $10 billion in agency MBS) seems likely - and that would be the final asset purchases.
Analysts will be looking for comments on rate hikes (likely in March), runoff of assets (not reinvesting), and possibly even comments on future balance sheet reduction.
Note: No projections will be released at this meeting. However, for review, here are the Here are the December projections. In December, most participants expected 3 rate hikes in 2022.
Wall Street forecasts are for GDP to increase at close to a 6.0% annual rate in Q4 that would put Q4-over-Q4 close to the December projections.
1 Projections of change in real GDP and inflation are from the fourth quarter of the previous year to the fourth quarter of the year indicated.
The unemployment rate was at 3.9% in December. That put Q4 unemployment close to the December projections.
2 Projections for the unemployment rate are for the average civilian unemployment rate in the fourth quarter of the year indicated.
As of November 2021, PCE inflation was up 5.7% from November 2020.
So, inflation was above expectations in Q4.
PCE core inflation was up 4.7% in November year-over-year.
Core inflation was also above expectations in Q4.
Wall Street forecasts are for GDP to increase at close to a 6.0% annual rate in Q4 that would put Q4-over-Q4 close to the December projections.
| GDP projections of Federal Reserve Governors and Reserve Bank presidents, Change in Real GDP1 | ||||
|---|---|---|---|---|
| Projection Date | 2021 | 2022 | 2023 | 2024 |
| Dec 2021 | 5.5 | 3.6 to 4.5 | 2.0 to 2.5 | 1.8 to 2.0 |
| Sept 2021 | 5.8 to 6.0 | 3.4 to 4.5 | 2.2 to 2.5 | 2.0 to 2.2 |
The unemployment rate was at 3.9% in December. That put Q4 unemployment close to the December projections.
| Unemployment projections of Federal Reserve Governors and Reserve Bank presidents, Unemployment Rate2 | ||||
|---|---|---|---|---|
| Projection Date | 2021 | 2022 | 2023 | 2024 |
| Dec 2021 | 4.2 to 4.3 | 3.4 to 3.7 | 3.2 to 3.6 | 3.2 to 3.7 |
| Sept 2021 | 4.6 to 4.8 | 3.6 to 4.0 | 3.3 to 3.7 | 3.3 to 3.6 |
As of November 2021, PCE inflation was up 5.7% from November 2020.
So, inflation was above expectations in Q4.
| Inflation projections of Federal Reserve Governors and Reserve Bank presidents, PCE Inflation1 | ||||
|---|---|---|---|---|
| Projection Date | 2021 | 2022 | 2023 | 2024 |
| Dec 2021 | 5.3 to 5.4 | 2.2 to 3.0 | 2.1 to 2.5 | 2.0 to 2.2 |
| Sept 2021 | 4.0 to 4.3 | 2.0 to 2.5 | 2.0 to 2.3 | 2.0 to 2.2 |
PCE core inflation was up 4.7% in November year-over-year.
Core inflation was also above expectations in Q4.
| Core Inflation projections of Federal Reserve Governors and Reserve Bank presidents, Core Inflation1 | ||||
|---|---|---|---|---|
| Projection Date | 2021 | 2022 | 2023 | 2024 |
| Dec 2021 | 4.4 | 2.5 to 3.0 | 2.1 to 2.4 | 2.0 to 2.2 |
| Sept 2021 | 3.6 to 3.8 | 2.0 to 2.5 | 2.0 to 2.3 | 2.0 to 2.2 |
Saturday, January 22, 2022
Real Estate Newsletter Articles this Week
by Calculated Risk on 1/22/2022 02:11:00 PM
At the Calculated Risk Real Estate Newsletter this week:
• 1.44 million Total Housing Completions in 2021 including Manufactured Homes Most since 2007
• Existing-Home Sales Decreased to 6.18 million in December Inventory down 14.2% year-over-year
• December Housing Starts: Most Housing Units Under Construction Since 1973 Housing Starts Increased to 1.702 million Annual Rate in December
• 4th Look at Local Housing Markets in December
• Altos Research: Existing Home Inventory at Record Low "Investor/speculator activity merits attention"
This is usually published several times a week, and provides more in-depth analysis of the housing market.
The blog will continue as always!
You can subscribe at https://calculatedrisk.substack.com/ Most content is available for free, but please subscribe!.
You can subscribe at https://calculatedrisk.substack.com/ Most content is available for free, but please subscribe!.
Schedule for Week of January 23, 2022
by Calculated Risk on 1/22/2022 08:11:00 AM
The key reports scheduled for this week are the advance estimate of Q4 GDP and December New Home sales. Other key indicators include December Personal Income and Outlays and November Case-Shiller house prices.
For manufacturing, the Richmond and Kansas City Fed manufacturing surveys will be released.
The FOMC meets this week, and they are expected to announce the final asset purchases.
8:30 AM ET: Chicago Fed National Activity Index for December. This is a composite index of other data.
9:00 AM: FHFA House Price Index for November. This was originally a GSE only repeat sales, however there is also an expanded index.
 9:00 AM ET: S&P/Case-Shiller House Price Index for November.
This graph shows the Year over year change in the nominal seasonally adjusted National Index, Composite 10 and Composite 20 indexes through the most recent report (the Composite 20 was started in January 2000).
The consensus is for a 18.0% year-over-year increase in the Comp 20 index.
10:00 AM: Richmond Fed Survey of Manufacturing Activity for January.
10:00 AM: State Employment and Unemployment (Monthly) for December 2021
7:00 AM ET: The Mortgage Bankers Association (MBA) will release the results for the mortgage purchase applications index.
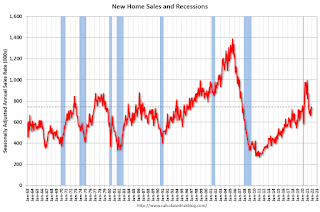 10:00 AM: New Home Sales for December from the Census Bureau.
 This graph shows New Home Sales since 1963.
The dashed line is the sales rate for last month.
The consensus is for 760 thousand SAAR, up from 744 thousand in November.
2:00 PM: FOMC Meeting Statement. The FOMC is expected to announce the final asset purchases.
2:30 PM: Fed Chair Jerome Powell holds a press briefing following the FOMC announcement.
8:30 AM: Gross Domestic Product, 4th quarter 2021 (Advance estimate). The consensus is that real GDP increased 5.4% annualized in Q4.
8:30 AM: The initial weekly unemployment claims report will be released. The consensus is for a decrease to 260 thousand from 286 thousand last week.
8:30 AM: Durable Goods Orders for December. The consensus is for a 0.5% decrease in durable goods.
10:00 AM: Pending Home Sales Index for December. The consensus is for a 0.3% increase in the index.
11:00 AM: the Kansas City Fed manufacturing survey for January. This is the last of regional manufacturing surveys for January.
8:30 AM ET: Personal Income and Outlays for December. The consensus is for a 0.5% increase in personal income, and for a 0.5% decrease in personal spending. And for the Core PCE price index to increase 0.5%.
10:00 AM: University of Michigan's Consumer sentiment index (Final for January). The consensus is for a reading of 68.6.
Friday, January 21, 2022
COVID Update January 21, 2022: New Cases Declining
by Calculated Risk on 1/21/2022 09:23:00 PM
Another COVID update. Hopefully this wave declines soon. Best to all.
| COVID Metrics | ||||
|---|---|---|---|---|
| Now | Week Ago | Goal | ||
| Percent fully Vaccinated | 63.3% | --- | ≥70.0%1 | |
| Fully Vaccinated (millions) | 210.0 | --- | ≥2321 | |
| New Cases per Day3 | 726,870 | 797,694 | ≤5,0002 | |
| Hospitalized3🚩 | 144,636 | 133,297 | ≤3,0002 | |
| Deaths per Day3🚩 | 1,843 | 1,754 | ≤502 | |
| 1 Minimum to achieve "herd immunity" (estimated between 70% and 85%). 2my goals to stop daily posts, 37-day average for Cases, Currently Hospitalized, and Deaths 🚩 Increasing 7-day average week-over-week for Cases, Hospitalized, and Deaths ✅ Goal met. | ||||
 Click on graph for larger image.
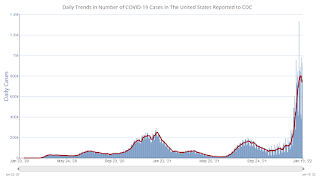
This graph shows the daily (columns) and 7-day average (line) of positive tests reported.
The 7-day average for new cases has declined somewhat, but hospitalizations are still at record levels.
Deaths are still increasing, but below the 7-day average record of 3,421 per day in January 2021.
1.44 million Total Housing Completions in 2021 including Manufactured Homes; Most since 2007
by Calculated Risk on 1/21/2022 03:04:00 PM
Today, in the CalculatedRisk Real Estate Newsletter: 1.44 million Total Housing Completions in 2021 including Manufactured Homes
Excerpt:
This graph shows total housing completions and placements since 1968. The net additional to the housing stock is less because of demolitions and destruction of older housing units.There is more in the post. You can subscribe at https://calculatedrisk.substack.com/
Even though there were significant construction delays in 2021 - and there are currently the most housing units under construction since 1973 - there were 1.444 million total completions in 2021, the most since 2007.
(Most content is available for free, so please subscribe).
Hotels: Occupancy Rate Down 16% Compared to Same Week in 2019
by Calculated Risk on 1/21/2022 11:59:00 AM
U.S. weekly hotel occupancy worsened in comparison with pre-pandemic levels, according to STR‘s latest data through Jan. 15.The following graph shows the seasonal pattern for the hotel occupancy rate using the four week average.
January 9-15, 2022 (percentage change from comparable week in 2019*):
• Occupancy: 48.8% (-16.3%)
• Average daily rate (ADR): $122.12 (-1.6%)
• Revenue per available room (RevPAR): $54.47 (-19.0%)
On an absolute basis, occupancy was higher than the previous week, but the gap to 2019 levels widened, pointing to a larger impact from the omicron variant. ADR and RevPAR were up week over week and when indexed to 2019. ...
*Due to the steep, pandemic-driven performance declines of 2020, STR is measuring recovery against comparable time periods from 2019.
emphasis added
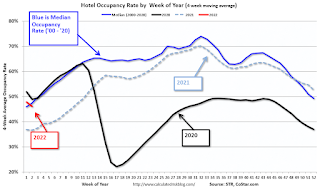 Click on graph for larger image.
The red line is for 2022, black is 2020, blue is the median, and dashed light blue is for 2021.
Although down compared to 2019, the 4-week average of the occupancy rate is close to the median rate for the previous 20 years (Blue).
Note: Y-axis doesn't start at zero to better show the seasonal change.
The 4-week average of the occupancy rate will increase seasonally over the next few months.
Q4 GDP Forecasts: 5% to 6%
by Calculated Risk on 1/21/2022 10:16:00 AM
The advance estimate of Q4 GDP will be released on Thursday, January 27th. The consensus estimate is for 6.0% real GDP growth (seasonally adjusted annual rate).
From BofA:
We expect the advance estimate of 4Q GDP to show a pickup in growth to 5.0% qoq saar. [January 21 estimate]From Goldman Sachs:
emphasis added
We left our Q4 GDP tracking estimate unchanged at +6.5% (qoq ar). [January 20 estimate]And from the Altanta Fed: GDPNow
The GDPNow model estimate for real GDP growth (seasonally adjusted annual rate) in the fourth quarter of 2021 is 5.1 percent on January 19, up from 5.0 percent on January 14. [January 19 estimate]
Black Knight: National Mortgage Delinquency Rate Decreased in December; Foreclosures at Record Low
by Calculated Risk on 1/21/2022 08:29:00 AM
Note: At the beginning of the pandemic, the delinquency rate increased sharply (see table below). Loans in forbearance are counted as delinquent in this survey, but those loans are not reported as delinquent to the credit bureaus.
From Black Knight: Black Knight: 2021 Ends With Foreclosures at All-Time Low and Near Record-Low Delinquency Rate; Serious Delinquencies Still More than 2X Pre-Pandemic Levels
• At 3.38% entering January, the national delinquency rate sits just 0.1% above February 2020’s near record-low of 3.28%, just prior to the onset of the pandemicAccording to Black Knight's First Look report, the percent of loans delinquent decreased 5.9% in December compared to November and decreased 44% year-over-year.
• However, over half a million excess serious delinquencies remain – borrowers 90 or more days past due on their mortgages, including those in active forbearance – more than twice pre-pandemic levels
• Just 0.24% of loans are in active foreclosure in December – an all-time low – with the month’s 4,100 foreclosure starts some 90% below December 2019 levels
• While roughly twice as many foreclosure sales (completions) occurred in the month as compared to December 2020, there were only one-third as many as in pre-pandemic December 2019
• Given the volume of borrowers who’ve exited forbearance protections in recent months, the industry must keep a very close eye on foreclosure metrics moving forward in 2022
• Prepayment activity fell by more than 7% in December and is poised to fall even further as rising rates continue to erode refinance incentive
emphasis added
The percent of loans in the foreclosure process decreased 3.8% in December and were down 28% over the last year.
Black Knight reported the U.S. mortgage delinquency rate (loans 30 or more days past due, but not in foreclosure) was 3.38% in December, down from 3.59% in November.
The percent of loans in the foreclosure process decreased in December to 0.24%, from 0.25% in November.
The number of delinquent properties, but not in foreclosure, is down 1,452,000 properties year-over-year, and the number of properties in the foreclosure process is down 50,000 properties year-over-year.
| Black Knight: Percent Loans Delinquent and in Foreclosure Process | ||||
|---|---|---|---|---|
| Dec 2021 | Nov 2021 | Dec 2020 | Dec 2019 | |
| Delinquent | 3.38% | 3.59% | 6.08% | 3.40% |
| In Foreclosure | 0.24% | 0.25% | 0.33% | 0.46% |
| Number of properties: | ||||
| Number of properties that are delinquent, but not in foreclosure: | 1,799,000 | 1,906,000 | 3,251,000 | 1,803,000 |
| Number of properties in foreclosure pre-sale inventory: | 128,000 | 132,000 | 178,000 | 245,000 |
| Total Properties | 1,927,000 | 2,039,000 | 3,429,000 | 2,047,000 |
Thursday, January 20, 2022
COVID Update, January 20, 2022
by Calculated Risk on 1/20/2022 08:54:00 PM
| COVID Metrics | ||||
|---|---|---|---|---|
| Now | Week Ago | Goal | ||
| Percent fully Vaccinated | 63.2% | --- | ≥70.0%1 | |
| Fully Vaccinated (millions) | 209.8 | --- | ≥2321 | |
| New Cases per Day3 | 744,615 | 783,922 | ≤5,0002 | |
| Hospitalized3🚩 | 143,874 | 129,442 | ≤3,0002 | |
| Deaths per Day3 | 1,749 | 1,754 | ≤502 | |
| 1 Minimum to achieve "herd immunity" (estimated between 70% and 85%). 2my goals to stop daily posts, 37-day average for Cases, Currently Hospitalized, and Deaths 🚩 Increasing 7-day average week-over-week for Cases, Hospitalized, and Deaths ✅ Goal met. | ||||
 Click on graph for larger image.
This graph shows the daily (columns) and 7-day average (line) of positive tests reported.
The 7-day average for new cases has declined slightly, but hospitalizations are at record levels.
Fortunately, deaths are still only half the previous 7-day average record of 3,421 per day in January 2021.


