 RSS Feed
 by Calculated Risk on 1/14/2022 12:59:00 PM
Friday, January 14, 2022
Q4 GDP Forecasts: Around 6%
From BofA:
Our 4Q GDP tracking estimate remains at 5.5% qoq saar. [January 14 estimate]From Goldman Sachs:
emphasis added
We lowered our Q4 GDP tracking estimate by ½pp to +6½% (qoq ar), to reflect the downside surprises this morning on both industrial production and retail sales. [January 14 estimate]And from the Altanta Fed: GDPNow
The GDPNow model estimate for real GDP growth (seasonally adjusted annual rate) in the fourth quarter of 2021 is 5.0 percent on January 14, down from 6.8 percent on January 10. [January 14 estimate]
Industrial Production Decreased 0.1 Percent in December
by Calculated Risk on 1/14/2022 09:20:00 AM
From the Fed: Industrial Production and Capacity Utilization
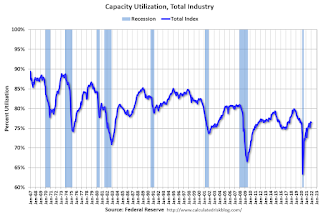
Industrial production declined 0.1 percent in December. Losses of 0.3 percent for manufacturing and 1.5 percent for utilities were mostly offset by a gain of 2.0 percent for mining. For the fourth quarter as a whole, total industrial production rose at an annual rate of 4.0 percent. At 101.9 percent of its 2017 average, total industrial production in December was 3.7 percent higher than it was at the end of 2020 and 0.6 percent above its pre-pandemic (February 2020) reading. Capacity utilization for the industrial sector edged down 0.1 percentage point in December to 76.5 percent, a rate that is 3.1 percentage points below its long-run (1972–2020) average.
emphasis added
 Click on graph for larger image.
This graph shows Capacity Utilization. This series is up from the record low set in April 2020, and above the level in February 2020 (pre-pandemic).
Capacity utilization at 76.5% is 3.1% below the average from 1972 to 2020. This was well below consensus expectations.
Note: y-axis doesn't start at zero to better show the change.
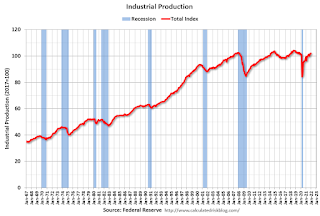 The second graph shows industrial production since 1967.
Industrial production decreased in December to 101.9. This is above the February 2020 level.
The change in industrial production was below consensus expectations.
Retail Sales Decreased 1.9% in December
by Calculated Risk on 1/14/2022 08:38:00 AM
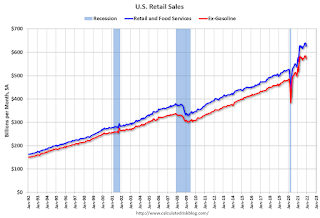
On a monthly basis, retail sales were decreased 1.9% from November to December (seasonally adjusted), but sales were up 16.9 percent from December 2020.
From the Census Bureau report:
Advance estimates of U.S. retail and food services sales for December 2021, adjusted for seasonal variation and holiday and trading-day differences, but not for price changes, were $626.8 billion, a decrease of 1.9 percent from the previous month, but 16.9 percent above December 2020.
emphasis added
 Click on graph for larger image.
This graph shows retail sales since 1992. This is monthly retail sales and food service, seasonally adjusted (total and ex-gasoline).
Retail sales ex-gasoline were down 2.0% in December.
The second graph shows the year-over-year change in retail sales and food service (ex-gasoline) since 1993.
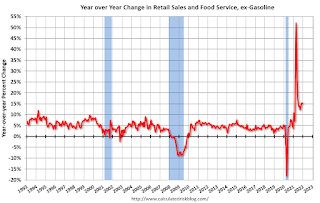 Retail and Food service sales, ex-gasoline, increased by 15.2% on a YoY basis.
Sales in December were well below expectations, and sales in October and November were revised down, combined.
Thursday, January 13, 2022
Friday: Retail Sales, Industrial Production
by Calculated Risk on 1/13/2022 08:16:00 PM
Friday:
• At 8:30 AM ET, Retail sales for December is scheduled to be released. The consensus is for a 0.1% decrease in retail sales.
• At 9:15 AM, The Fed will release Industrial Production and Capacity Utilization for December. The consensus is for a 0.3% increase in Industrial Production, and for Capacity Utilization to increase to 77.0%.
• At 10:00 AM, University of Michigan's Consumer sentiment index (Preliminary for January).
And on COVID (focus on hospitalizations and deaths):
| COVID Metrics | ||||
|---|---|---|---|---|
| Now | Week Ago | Goal | ||
| Percent fully Vaccinated | 62.7% | --- | ≥70.0%1 | |
| Fully Vaccinated (millions) | 208.2 | --- | ≥2321 | |
| New Cases per Day3🚩 | 782,765 | 587,722 | ≤5,0002 | |
| Hospitalized3🚩 | 128,222 | 95,853 | ≤3,0002 | |
| Deaths per Day3🚩 | 1,729 | 1,263 | ≤502 | |
| 1 Minimum to achieve "herd immunity" (estimated between 70% and 85%). 2my goals to stop daily posts, 37-day average for Cases, Currently Hospitalized, and Deaths 🚩 Increasing 7-day average week-over-week for Cases, Hospitalized, and Deaths ✅ Goal met. | ||||
 Click on graph for larger image.
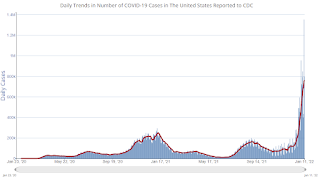
This graph shows the daily (columns) and 7-day average (line) of positive tests reported.
The 7-day average for new cases and hospitalizations are at record levels.
Fortunately, deaths are still only half the previous 7-day average record of 3,421 per day in January 2021.
Hotels: Occupancy Rate Down 15% Compared to Same Week in 2019
by Calculated Risk on 1/13/2022 01:22:00 PM
From CoStar: STR: US Hotel Performance Dips From Holiday Week
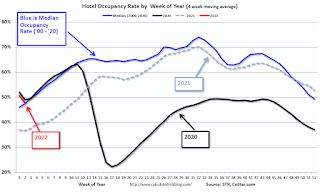
Reflecting post-holiday seasonality, U.S. hotel performance fell from the previous week, according to STR‘s latest data through Jan. 8.The following graph shows the seasonal pattern for the hotel occupancy rate using the four week average.
Jan. 2-8, 2022 (percentage change from comparable week in 2019*):
• Occupancy: 45.4% (-14.9%)
• Average daily rate (ADR): $119.92 (-4.8%)
• Revenue per available room (RevPAR): $54.47 (-19.0%)
Occupancy fell week over week because of a slowdown in leisure demand and a continued absence of business travel due to a Saturday holiday. While ADR also dropped from an all-time high the previous week, the metric came in at roughly 95% of the 2019 comparable. ...
*Due to the steep, pandemic-driven performance declines of 2020, STR is measuring recovery against comparable time periods from 2019.
emphasis added
 Click on graph for larger image.
The red line is for 2022, black is 2020, blue is the median, and dashed light blue is for 2021.
Although down compared to 2019, the 4-week average of the occupancy rate is close to the median rate for the previous 20 years (Blue).
Note: Y-axis doesn't start at zero to better show the seasonal change.
The 4-week average of the occupancy rate will increase seasonally over the next few months.
3rd Look at Local Housing Markets in December
by Calculated Risk on 1/13/2022 10:43:00 AM
Today, in the Calculated Risk Real Estate Newsletter: 3rd Look at Local Housing Markets in December
A brief excerpt:
Adding Albuquerque, Colorado, Houston, Memphis, Nashville, Sacramento, Santa Clara and South CarolinaThere is much more in the article. You can subscribe at https://calculatedrisk.substack.com/
...
Here is a summary of active listings for these housing markets in December. Inventory was down 17.7% in December month-over-month (MoM) from November, and down 30.0% year-over-year (YoY).
Inventory almost always declines seasonally in December, so the MoM decline is not a surprise. Last month, these markets were down 26.2% YoY, so the YoY decline in December is larger than in November. This isn’t indicating a slowing market.
Notes for all tables:
1. New additions to table in BOLD.
2. Northwest (Seattle), North Texas (Dallas), and Santa Clara (San Jose), Jacksonville, Source: Northeast Florida Association of REALTORS®
Totals do not include Denver (included in state total).
Weekly Initial Unemployment Claims Increase to 230,000
by Calculated Risk on 1/13/2022 08:34:00 AM
The DOL reported:
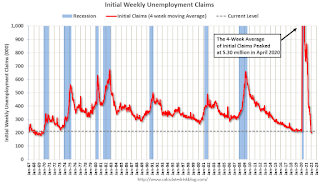
In the week ending January 8, the advance figure for seasonally adjusted initial claims was 230,000, an increase of 23,000 from the previous week's unrevised level of 207,000. The 4-week moving average was 210,750, an increase of 6,250 from the previous week's unrevised average of 204,500.The following graph shows the 4-week moving average of weekly claims since 1971.
emphasis added
 Click on graph for larger image.
The dashed line on the graph is the current 4-week average. The four-week average of weekly unemployment claims increased to 210,750.
The previous week was unrevised.
Weekly claims were above the consensus forecast, perhaps due to the current COVID wave.
Wednesday, January 12, 2022
Thursday: Unemployment Claims, PPI
by Calculated Risk on 1/12/2022 08:52:00 PM
Thursday:
• At 8:30 AM ET, the initial weekly unemployment claims report will be released. The consensus is for 210 thousand initial claims.
• Also, at 8:30 AM, The Producer Price Index for December from the BLS. The consensus is for a 0.4% increase in PPI, and a 0.5% increase in core PPI.
• At 10:00 AM, Testimony, Fed Governor Lael Brainard, Nomination Hearing, Before the Committee on Banking, Housing, and Urban Affairs, U.S. Senate
And on COVID (focus on hospitalizations and deaths):
| COVID Metrics | ||||
|---|---|---|---|---|
| Now | Week Ago | Goal | ||
| Percent fully Vaccinated | 62.6% | --- | ≥70.0%1 | |
| Fully Vaccinated (millions) | 208.0 | --- | ≥2321 | |
| New Cases per Day3🚩 | 761,535 | 556,134 | ≤5,0002 | |
| Hospitalized3🚩 | 124,163 | 91,030 | ≤3,0002 | |
| Deaths per Day3🚩 | 1,656 | 1,238 | ≤502 | |
| 1 Minimum to achieve "herd immunity" (estimated between 70% and 85%). 2my goals to stop daily posts, 37-day average for Cases, Currently Hospitalized, and Deaths 🚩 Increasing 7-day average week-over-week for Cases, Hospitalized, and Deaths ✅ Goal met. | ||||
 Click on graph for larger image.
This graph shows the daily (columns) and 7-day average (line) of positive tests reported.
The 7-day average for new cases and hospitalizations are at record levels.
Fortunately, deaths are still below the previous 7-day average record of 3,421 per day in January 2021.
Fed's Beige Book: "A sudden pull back in leisure travel, hotel occupancy and patronage at restaurants"
by Calculated Risk on 1/12/2022 03:08:00 PM
Fed's Beige Book "This report was prepared at the Federal Reserve Bank of Kansas City based on information collected on or before January 3, 2022."
Economic activity across the United States expanded at a modest pace in the final weeks of 2021. Contacts from many Districts indicated growth continued to be constrained by ongoing supply chain disruptions and labor shortages. Despite the modest pace of growth, demand for materials and inputs, and demand for workers, remained elevated among businesses. Lending activity picked up slightly toward the end of the year, led by commercial real estate borrowers. Consumer spending continued to grow at a steady pace ahead of the rapid spread of the Omicron COVID-19 variant. Most Districts noted a sudden pull back in leisure travel, hotel occupancy and patronage at restaurants as the number of new cases rose in recent weeks. Although optimism remained high generally, several Districts cited reports from businesses that expectations for growth over the next several months cooled somewhat during the last few weeks. The manufacturing sector continued to expand nationally, with some regional differences in the pace of growth. Overall activity in the transportation sector expanded at a moderate pace. While farm incomes were elevated throughout 2021, agricultural conditions were marred by drought conditions across several Districts.
...
Employment grew modestly in recent weeks, but contacts from most Districts reported that demand for additional workers remains strong. Job openings were up but overall payroll growth was constrained by persistent labor shortages. Tightness in labor markets drove robust wage growth nationwide, with some Districts highlighting additional growth in labor costs associated with non-wage benefits. While many contacts noted that wage gains among low-skill workers were particularly strong, compensation growth remained well above historical averages across industries, across worker demographics, and across geographies. Besides wage gains, many contacts indicated adjustments to job demands – such as accommodating part-time work or adjusting qualification requirements – to attract more applicants and retain existing workforces.
emphasis added
Cleveland Fed: Median CPI increased 0.4% and Trimmed-mean CPI increased 0.4% in December
by Calculated Risk on 1/12/2022 12:38:00 PM
The Cleveland Fed released the median CPI and the trimmed-mean CPI this morning:
According to the Federal Reserve Bank of Cleveland, the median Consumer Price Index rose 0.4% in December. The 16% trimmed-mean Consumer Price Index increased 0.4% in December. "The median CPI and 16% trimmed-mean CPI are measures of core inflation calculated by the Federal Reserve Bank of Cleveland based on data released in the Bureau of Labor Statistics’ (BLS) monthly CPI report".
Note: The Cleveland Fed released the median CPI details here: "Used Cars" were up 51% annualized.
Note that Owners' Equivalent Rent and Rent of Primary Residence account for almost 1/3 of median CPI, and these measures were up around 5% annualized in December.
 Click on graph for larger image.
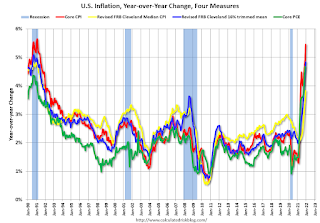
This graph shows the year-over-year change for these four key measures of inflation.
Click on graph for larger image.This graph shows the year-over-year change for these four key measures of inflation.
On a year-over-year basis, the median CPI rose 3.8%, the trimmed-mean CPI rose 4.8%, and the CPI less food and energy rose 5.5%. Core PCE is for November and increased 4.7% year-over-year.


