 RSS Feed
 by Calculated Risk on 1/13/2022 01:22:00 PM
Thursday, January 13, 2022
Hotels: Occupancy Rate Down 15% Compared to Same Week in 2019
From CoStar: STR: US Hotel Performance Dips From Holiday Week
Reflecting post-holiday seasonality, U.S. hotel performance fell from the previous week, according to STR‘s latest data through Jan. 8.The following graph shows the seasonal pattern for the hotel occupancy rate using the four week average.
Jan. 2-8, 2022 (percentage change from comparable week in 2019*):
• Occupancy: 45.4% (-14.9%)
• Average daily rate (ADR): $119.92 (-4.8%)
• Revenue per available room (RevPAR): $54.47 (-19.0%)
Occupancy fell week over week because of a slowdown in leisure demand and a continued absence of business travel due to a Saturday holiday. While ADR also dropped from an all-time high the previous week, the metric came in at roughly 95% of the 2019 comparable. ...
*Due to the steep, pandemic-driven performance declines of 2020, STR is measuring recovery against comparable time periods from 2019.
emphasis added
 Click on graph for larger image.
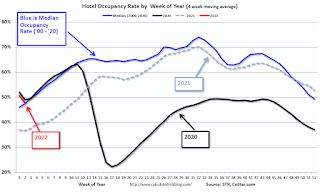
The red line is for 2022, black is 2020, blue is the median, and dashed light blue is for 2021.
Although down compared to 2019, the 4-week average of the occupancy rate is close to the median rate for the previous 20 years (Blue).
Note: Y-axis doesn't start at zero to better show the seasonal change.
The 4-week average of the occupancy rate will increase seasonally over the next few months.


