by Calculated Risk on 10/30/2021 08:11:00 AM
Saturday, October 30, 2021
Schedule for Week of October 31, 2021
Boo!
The key report this week is the October employment report on Friday.
Other key indicators include the October ISM manufacturing and services indexes, October vehicle sales, and the September trade deficit.
The FOMC meets on Tuesday and Wednesday this week, and they are expected to announce tapering of asset purchases.
10:00 AM: ISM Manufacturing Index for October. The consensus is for 60.5%, down from 61.1%.
10:00 AM: Construction Spending for September. The consensus is for 0.4% increase in spending.
8:00 AM ET: Corelogic House Price index for September.
10:00 AM: The Q3 Housing Vacancies and Homeownership report from the Census Bureau.
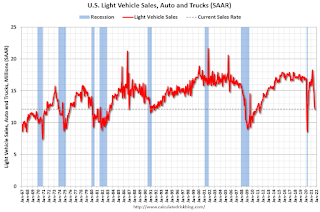 All day: Light vehicle sales for October.
The consensus is for sales of 12.4 million SAAR, up from 12.2 million SAAR in September (Seasonally Adjusted Annual Rate).
This graph shows light vehicle sales since the BEA started keeping data in 1967. The dashed line is the current sales rate.
7:00 AM ET: The Mortgage Bankers Association (MBA) will release the results for the mortgage purchase applications index.
8:15 AM: The ADP Employment Report for October. This report is for private payrolls only (no government). The consensus is for 400,000 jobs added, down from 568,000 in September.
10:00 AM: the ISM Services Index for October. The consensus is for a decrease to 59.5 from 61.9.
2:00 PM: FOMC Meeting Announcement. The FOMC is expected to announce tapering of asset purchases at this meeting.
2:30 PM: Fed Chair Jerome Powell holds a press briefing following the FOMC announcement.
8:30 AM: The initial weekly unemployment claims report will be released. The consensus is for 275 thousand initial claims, down from 281 thousand last week.
 8:30 AM: Trade Balance report for September from the Census Bureau. The consensus is for the deficit to be $74.1 billion in September, from $73.3 billion in August.
This graph shows the U.S. trade deficit, with and without petroleum, through the most recent report. The blue line is the total deficit, and the black line is the petroleum deficit, and the red line is the trade deficit ex-petroleum products.
 8:30 AM: Employment Report for October. The consensus is for 450 thousand jobs added, and for the unemployment rate to decrease to 4.7%.
There were 194 thousand jobs added in September, and the unemployment rate was at 4.8%.
This graph shows the job losses from the start of the employment recession, in percentage terms.
The current employment recession was by far the worst recession since WWII in percentage terms, but currently is not as severe as the worst of the "Great Recession".
Friday, October 29, 2021
Fannie Mae: Mortgage Serious Delinquency Rate Decreased in September
by Calculated Risk on 10/29/2021 04:10:00 PM
Fannie Mae reported that the Single-Family Serious Delinquency decreased to 1.62% in September, from 1.79% in August. The serious delinquency rate is down from 3.20% in September 2020.
These are mortgage loans that are "three monthly payments or more past due or in foreclosure".
The Fannie Mae serious delinquency rate peaked in February 2010 at 5.59% following the housing bubble, and peaked at 3.32% in August 2020 during the pandemic.
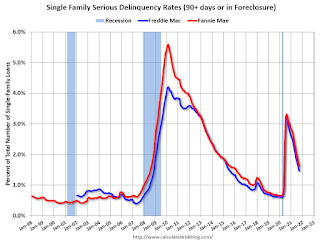
By vintage, for loans made in 2004 or earlier (1% of portfolio), 4.25% are seriously delinquent (down from 4.47% in August). For loans made in 2005 through 2008 (2% of portfolio), 7.21% are seriously delinquent (down from 7.57%), For recent loans, originated in 2009 through 2021 (97% of portfolio), 1.31% are seriously delinquent (down from 1.46%). So Fannie is still working through a few poor performing loans from the bubble years.
Mortgages in forbearance are counted as delinquent in this monthly report, but they will not be reported to the credit bureaus.
This is very different from the increase in delinquencies following the housing bubble. Lending standards have been fairly solid over the last decade, and most of these homeowners have equity in their homes - and they will be able to restructure their loans once they are employed.
Freddie Mac reported earlier.
October 29th COVID-19: Still Close to 70,000 Cases per Day
by Calculated Risk on 10/29/2021 03:34:00 PM
| COVID Metrics | ||||
|---|---|---|---|---|
| Today | Week Ago | Goal | ||
| Percent fully Vaccinated | 57.8% | 57.3% | ≥70.0%1 | |
| Fully Vaccinated (millions) | 192.0 | 190.2 | ≥2321 | |
| New Cases per Day3 | 68,177 | 73,020 | ≤5,0002 | |
| Hospitalized3 | 44,829 | 50,335 | ≤3,0002 | |
| Deaths per Day3 | 1,086 | 1,232 | ≤502 | |
| 1 Minimum to achieve "herd immunity" (estimated between 70% and 85%). 2my goals to stop daily posts, 37 day average for Cases, Currently Hospitalized, and Deaths 🚩 Increasing 7 day average week-over-week for Cases, Hospitalized, and Deaths ✅ Goal met. | ||||
IMPORTANT: For "herd immunity" most experts believe we need 70% to 85% of the total population fully vaccinated (or already had COVID). Note: COVID will probably stay endemic (at least for some time).
The following 20 states have between 50% and 59.9% fully vaccinated: Minnesota at 59.8%, Delaware, Hawaii, Florida, Wisconsin, Nebraska, Iowa, Illinois, Michigan, Kentucky, South Dakota, Texas, Arizona, Kansas, Nevada, Alaska, Utah, North Carolina, Ohio and Montana at 50.4%.
Next up (total population, fully vaccinated according to CDC) are Oklahoma at 49.9%, South Carolina at 49.9%, Indiana at 49.8%, Missouri at 49.7%, Georgia at 48.0%, and Arkansas at 47.9%.
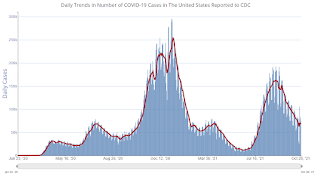 Click on graph for larger image.
This graph shows the daily (columns) and 7 day average (line) of positive tests reported.
Early Q4 GDP Forecasts: Around 5% to 6%
by Calculated Risk on 10/29/2021 02:51:00 PM
We are taking the glass-half-full approach and holding to our forecast for 6% real GDP growth in 4Q with a gradual slowing through the course of 2022. However, we acknowledge the risks to the downside particularly from higher inflation and weaker consumer sentiment, chiefly the expectations measures. [October 29 estimate]From Goldman Sachs
emphasis added
We launched our Q4 GDP tracking estimate at +4.5% (qoq ar). [October 29 estimate]And from the Altanta Fed: GDPNow
The initial GDPNow model estimate for real GDP growth (seasonally adjusted annual rate) in the fourth quarter of 2021 is 6.6 percent on October 29. [October 29 estimate]
Real Personal Income: Transfer Payments
by Calculated Risk on 10/29/2021 12:16:00 PM
The BEA released the Personal Income and Outlays, September 2021 report this morning. The report showed that government transfer payments were still almost $695 billion (on SAAR basis) above the February 2020 level (pre-pandemic) Note: Seasonal adjustment doesn't make sense with one time payments, but that is how the data is presented.
| Selected Transfer Payments Billions of dollars, SAAR | ||
|---|---|---|
| Other | Unemployment Insurance | |
| Jan-20 | $511 | $26 |
| Feb-20 | $506 | $26 |
| Mar-20 | $516 | $67 |
| Apr-20 | $3,393 | $435 |
| May-20 | $1,373 | $1,287 |
| Jun-20 | $743 | $1,396 |
| Jul-20 | $750 | $1,366 |
| Aug-20 | $697 | $612 |
| Sep-20 | $950 | $325 |
| Oct-20 | $714 | $296 |
| Nov-20 | $580 | $285 |
| Dec-20 | $604 | $319 |
| Jan-21 | $2,317 | $574 |
| Feb-21 | $735 | $558 |
| Mar-21 | $4,706 | $566 |
| Apr-21 | $1,345 | $516 |
| May-21 | $806 | $492 |
| Jun-21 | $744 | $433 |
| Jul-21 | $921 | $368 |
| Aug-21 | $944 | $352 |
| Sep-21 | $894 | $98 |
Black Knight: Number of Mortgages in Forbearance Declines Slightly
by Calculated Risk on 10/29/2021 10:14:00 AM
Note: Both Black Knight and the MBA (Mortgage Bankers Association) are putting out weekly estimates of mortgages in forbearance.
This data is as of October 26th.
From Andy Walden at Black Knight: Forbearance Plan Exits Steady Ahead of Month-End Deadlines
The number of mortgage holders exiting forbearance held steady this week and is expected to accelerate over the next few days with month-end deadlines looming.
According to our McDash Flash daily forbearance tracking dataset, the number of active forbearance plans fell 19,000 (-1.5%), with declines of 7,900 among GSE loans, 7,700 among FHA/VA mortgages and 3,300 among portfolio-held and privately securitized (PLS) mortgages. That’s modestly better than last week’s 7,300 (-0.6%) decrease.
As of October 26, 1.22 million mortgage holders remain in COVID-19 related forbearance plans. That’s 2.3% of all active mortgages, including 1.3% of GSE, 3.8% of FHA/VA and 3% of portfolio held and privately securitized loans.
Click on graph for larger image.
More than 470,000 homeowners left forbearance in the first 26 days of October, making it the largest month for exit activity in more than a year. And with more than 225,000 plans still up for review before the end of the month, including 140,000 facing final expiration, that number is likely to increase significantly in coming weeks.
Forbearance plan starts edged slightly higher this week but are still down 28% from the same time last month.
emphasis added
Personal Income Decreased 1.0% in September, Spending Increased 0.6%
by Calculated Risk on 10/29/2021 08:35:00 AM
The BEA released the Personal Income and Outlays report for September:
Personal income decreased $216.2 billion (1.0 percent) in September according to estimates released today by the Bureau of Economic Analysis. Disposable personal income (DPI) decreased $236.9 billion (1.3 percent) and personal consumption expenditures (PCE) increased $93.4 billion (0.6 percent).The September PCE price index increased 4.4 percent year-over-year and the September PCE price index, excluding food and energy, increased 3.6 percent year-over-year.
Real DPI decreased 1.6 percent in September and Real PCE increased 0.3 percent; goods increased 0.1 percent and services increased 0.4 percent. The PCE price index increased 0.3 percent. Excluding food and energy, the PCE price index increased 0.2 percent.
emphasis added
The following graph shows real Personal Consumption Expenditures (PCE) through September 2021 (2012 dollars). Note that the y-axis doesn't start at zero to better show the change.
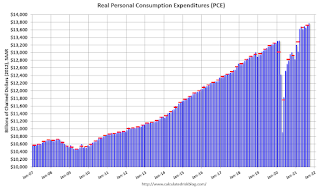 Click on graph for larger image.
The dashed red lines are the quarterly levels for real PCE.
Personal income was below expectations, and the increase in PCE was at expectations.
Thursday, October 28, 2021
Friday: Personal Income and Outlays, Chicago PMI
by Calculated Risk on 10/28/2021 09:00:00 PM
Thursday:
• At 8:30 AM ET, Personal Income and Outlays for September. The consensus is for a 0.1% decrease in personal income, and for a 0.5% increase in personal spending. And for the Core PCE price index to increase 0.2%.
• At 9:45 AM, Chicago Purchasing Managers Index for October. The consensus is for a reading of 64.0, down from 64.7 in September.
• At 10:00 AM, University of Michigan's Consumer sentiment index (Final for October). The consensus is for a reading of 71.6.
Las Vegas Visitor Authority for September: Convention Attendance N/A, Visitor Traffic Down 16% Compared to 2019
by Calculated Risk on 10/28/2021 04:29:00 PM
From the Las Vegas Visitor Authority: September 2021 Las Vegas Visitor Statistics
With stronger weekends but declines midweek vs. August 2021, September visitation saw some stabilization at approximately 2.9M visitors (down ‐2.1% MoM and down ‐15.5% from September 2019) after seeing sharper declines in August as the COVID Delta variant surged.
Hotel occupancy reached 73.0% for the month (up 0.2 pts MoM, down ‐15.3 pts vs. September 2019), as Weekend occupancy improved month‐over‐month to 89.1% (up 2.0 pts MoM) while Midweek occupancy declined from the prior month to 66.1% (down ‐1.7 pts MoM).
September room rates exceeded $155, the highest in the pandemic era, up 11.0% MoM and up 13.6% vs. September 2019 as RevPAR came in at $113.73, up 11.3% MoM and down ‐6.1% vs. September 2019
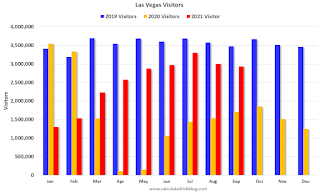 Click on graph for larger image.
 Thist graph shows visitor traffic for 2019 (blue), 2020 (orange) and 2021 (red).
Visitor traffic was down 15.5% compared to the same month in 2019.
October 28th COVID-19: Slow Progress
by Calculated Risk on 10/28/2021 04:07:00 PM
| COVID Metrics | ||||
|---|---|---|---|---|
| Today | Week Ago | Goal | ||
| Percent fully Vaccinated | 57.6% | 57.2% | ≥70.0%1 | |
| Fully Vaccinated (millions) | 191.2 | 189.9 | ≥2321 | |
| New Cases per Day3 | 68,792 | 74,290 | ≤5,0002 | |
| Hospitalized3 | 45,513 | 51,175 | ≤3,0002 | |
| Deaths per Day3 | 1,129 | 1,246 | ≤502 | |
| 1 Minimum to achieve "herd immunity" (estimated between 70% and 85%). 2my goals to stop daily posts, 37 day average for Cases, Currently Hospitalized, and Deaths 🚩 Increasing 7 day average week-over-week for Cases, Hospitalized, and Deaths ✅ Goal met. | ||||
IMPORTANT: For "herd immunity" most experts believe we need 70% to 85% of the total population fully vaccinated (or already had COVID). Note: COVID will probably stay endemic (at least for some time).
The following 20 states have between 50% and 59.9% fully vaccinated: Delaware at 59.7%, Minnesota, Hawaii, Florida, Wisconsin, Nebraska, Iowa, Illinois, Michigan, Kentucky, South Dakota, Texas, Arizona, Kansas, Nevada, Alaska, Utah, North Carolina, Ohio and Montana at 50.3%.
Next up (total population, fully vaccinated according to CDC) are Oklahoma at 49.8%, South Carolina at 49.8%, Indiana at 49.7%, Missouri at 49.6%, Georgia at 48.0%, and Arkansas at 47.8%.
 Click on graph for larger image.
This graph shows the daily (columns) and 7 day average (line) of positive tests reported.


