 RSS Feed
 by Calculated Risk on 9/24/2021 04:18:00 PM
Friday, September 24, 2021
Black Knight: Number of Homeowners in COVID-19-Related Forbearance Plans Declined Slightly
Note: Both Black Knight and the MBA (Mortgage Bankers Association) are putting out weekly estimates of mortgages in forbearance.
This data is as of September 21st.
From Andy Walden at Black Knight: Little Movement in Forbearance Volumes This Week
The number of active forbearance plans fell by 18,000 (-1.4%) this week, leaving 1.58 million U.S. homeowners in COVID-19 forbearance as of September [21].
Declines of 11,000 and 10,000 among FHA/VA and GSE loans respectively were partially offset by a 3,000 rise in PLS/portfolio plans. Overall, forbearances are now down 182,000 (-10%) from the same time last month, with the strongest decline (-13%) seen among GSE plans.
The population of mortgage holders in COVID-19 related forbearance plans represents 3% of all active mortgages, including 1.7% of GSE, 5.2% of FHA/VA and 3.8% of portfolio held and privately securitized loans.
In terms of forbearance plan starts, 15,000 new plans were initiated since last Tuesday – down slightly from last week’s 16,000 starts – while 34,000 plans were restarted, compared to last week’s volume of 35,000. Meanwhile, in typical mid-month behavior, plan exits dipped slightly this week, but are expected to ramp up in coming weeks.
Click on graph for larger image.
More than 460,000 plans are still slated for review for extension/removal over the final week of September, with some 300,000 set to reach their final expirations based on current allowable forbearance term lengths. This could lead to significant movement in volumes entering early October.
emphasis added

September 24th COVID-19: 7-Day Average Cases off 27% from Recent Peak
by Calculated Risk on 9/24/2021 04:13:00 PM
The CDC is the source for all data.
According to the CDC, on Vaccinations. Total doses administered: 388,567,109, as of a week ago 383,994,877, or 0.65 million doses per day.
| COVID Metrics | ||||
|---|---|---|---|---|
| Today | Week Ago | Goal | ||
| Percent fully Vaccinated | 55.1% | 54.4% | ≥70.0%1 | |
| Fully Vaccinated (millions) | 183.0 | 180.6 | ≥2321 | |
| New Cases per Day3 | 117,066 | 142,885 | ≤5,0002 | |
| Hospitalized3 | 80,957 | 89,248 | ≤3,0002 | |
| Deaths per Day3🚩 | 1,559 | 1,553 | ≤502 | |
| 1 Minimum to achieve "herd immunity" (estimated between 70% and 85%). 2my goals to stop daily posts, 37 day average for Cases, Currently Hospitalized, and Deaths 🚩 Increasing 7 day average week-over-week for Cases, Hospitalized, and Deaths ✅ Goal met. | ||||
IMPORTANT: For "herd immunity" most experts believe we need 70% to 85% of the total population fully vaccinated (or already had COVID).
KUDOS to the residents of the 13 states that have achieved 60% of total population fully vaccinated: Vermont at 69.2%, Connecticut, Maine, Rhode Island, Massachusetts, New Jersey, Maryland, New York, New Mexico, New Hampshire, Oregon, Washington, and Virginia at 60.0%.
The following 19 states and D.C. have between 50% and 59.9% fully vaccinated: District of Columbia at 59.6%, Colorado, California, Minnesota, Hawaii, Pennsylvania, Delaware, Florida, Wisconsin, Nebraska, Iowa, Illinois, Michigan, Kentucky, South Dakota, Texas, Arizona, Kansas, Nevada, and Utah at 50.2%.
Next up (total population, fully vaccinated according to CDC) are Ohio at 49.9%, Alaska at 49.7%, North Carolina 49.2%, Indiana at 48.1% and Montana at 48.1%.
 Click on graph for larger image.
This graph shows the daily (columns) and 7 day average (line) of positive tests reported.
Q3 GDP Forecasts: Around 4.5%
by Calculated Risk on 9/24/2021 12:32:00 PM
GDP forecasts had been downgraded sharply for Q3 due to COVID, but now seem to have stabilized.
Here is a table of some of the forecasts over the last two months.
| Merrill | Goldman | GDPNow | |
|---|---|---|---|
| 7/30/21 | 7.0% | 9.0% | 6.1% |
| 8/20/21 | 4.5% | 5.5% | 6.1% |
| 9/10/21 | 4.5% | 3.5% | 3.7% |
| 9/17/21 | 4.5% | 4.5% | 3.6% |
| 9/24/21 | 4.5% | 4.5% | 3.7% |
From BofA Merrill Lynch:
We continue to track 4.5% qoq saar for 3Q GDP. [Sept 24 estimate]From Goldman Sachs:
emphasis added
We left our Q3 GDP tracking estimate unchanged at +4.5% (qoq ar). [Sept 24 estimate]And from the Altanta Fed: GDPNow
The GDPNow model estimate for real GDP growth (seasonally adjusted annual rate) in the third quarter of 2021 is 3.7 percent on September 21, up from 3.6 percent on September 16. [Sept 21 estimate]
Comments on August New Home Sales
by Calculated Risk on 9/24/2021 11:02:00 AM
In the Newsletter I have Comments on August New Home Sales
Excerpt:
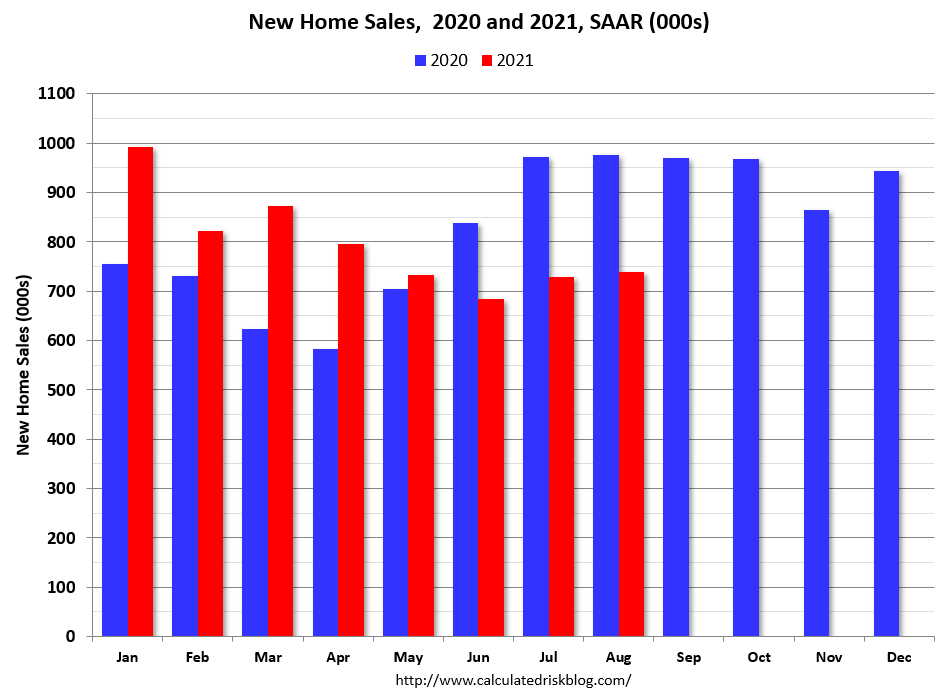
Sales, year to date in 2021, are only 2.4% ahead of sales in 20202, and new home sales in 2021 will be below sales in 2020 - since sales in 2020 finished strong.
This graph shows new home sales for 2020 and 2021 by month (Seasonally Adjusted Annual Rate).
New Home Sales Increase to 740,000 Annual Rate in August
by Calculated Risk on 9/24/2021 10:10:00 AM
The Census Bureau reports New Home Sales in August were at a seasonally adjusted annual rate (SAAR) of 740 thousand.
The previous three months were revised up, combined.
Sales of new single‐family houses in August 2021 were at a seasonally adjusted annual rate of 740,000, according to estimates released jointly today by the U.S. Census Bureau and the Department of Housing and Urban Development. This is 1.5 percent above the revised July rate of 729,000, but is 24.3 percent below the August 2020 estimate of 977,000.
emphasis added
 Click on graph for larger image.
The first graph shows New Home Sales vs. recessions since 1963. The dashed line is the current sales rate.
New home sales are now declining year-over-year since sales soared following the first few months of the pandemic.
The second graph shows New Home Months of Supply.
 The months of supply increased in August to 6.1 months from 6.0 months in July.
 The all time record high was 12.1 months of supply in January 2009. The all time record low was 3.5 months, most recently in October 2020.
This is above the normal range (about 4 to 6 months supply is normal).
"The seasonally‐adjusted estimate of new houses for sale at the end of August was 378,000. This represents a supply of 6.1 months at the current sales rate."
 The last graph shows sales NSA (monthly sales, not seasonally adjusted annual rate).
In August 2021 (red column), 62 thousand new homes were sold (NSA). Last year, 81 thousand homes were sold in August.
The all time high for August was 110 thousand in 2005, and the all time low for August was 23 thousand in 2010.
This was above expectations of 714 thousand SAAR and sales in the three previous months were revised up, combined. I'll have more later today.
September Vehicle Sales Forecast: "Disappearing Inventory Taking U.S. Light-Vehicle Sales to Another Low in September"
by Calculated Risk on 9/24/2021 07:57:00 AM
From WardsAuto: Disappearing Inventory Taking U.S. Light-Vehicle Sales to Another Low in September (pay content)
Low inventories and supply issues continue to impacting vehicle sales.
 Click on graph for larger image.
This graph shows actual sales from the BEA (Blue), and Wards forecast for September (Red).
The Wards forecast of 12.4 million SAAR, would be down about 5% from last month, and down 23.8% from a year ago (sales were solid in September 2020, as sales recovered from the depths of the pandemic).
Thursday, September 23, 2021
Friday: New Home Sales
by Calculated Risk on 9/23/2021 09:38:00 PM
Friday:
• At 10:00 AM ET, New Home Sales for August from the Census Bureau. The consensus is for 714 thousand SAAR, up from 708 thousand in July.
• Also at 10:00 AM, Opening Remarks, Fed Chair Jerome Powell, At Fed Listens: Perspectives on the Pandemic Recovery
September 23rd COVID-19: 55% of Americans Fully Vaccinated
by Calculated Risk on 9/23/2021 09:36:00 PM
The CDC is the source for all data.
According to the CDC, on Vaccinations. Total doses administered: 387,821,704, as of a week ago 383,038,403, or 0.68 million doses per day.
| COVID Metrics | ||||
|---|---|---|---|---|
| Today | Week Ago | Goal | ||
| Percent fully Vaccinated | 55.0% | 54.2% | ≥70.0%1 | |
| Fully Vaccinated (millions) | 182.6 | 180.1 | ≥2321 | |
| New Cases per Day3 | 121,532 | 146,684 | ≤5,0002 | |
| Hospitalized3 | 81,373 | 90,243 | ≤3,0002 | |
| Deaths per Day3🚩 | 1,556 | 1,545 | ≤502 | |
| 1 Minimum to achieve "herd immunity" (estimated between 70% and 85%). 2my goals to stop daily posts, 37 day average for Cases, Currently Hospitalized, and Deaths 🚩 Increasing 7 day average week-over-week for Cases, Hospitalized, and Deaths ✅ Goal met. | ||||
IMPORTANT: For "herd immunity" most experts believe we need 70% to 85% of the total population fully vaccinated (or already had COVID).
KUDOS to the residents of the 12 states that have achieved 60% of total population fully vaccinated: Vermont at 69.1%, Massachusetts, Maine, Connecticut, Rhode Island, Maryland. New Jersey, Washington, New York, New Mexico, New Hampshire and Oregon at 60.2%.
The following 20 states and D.C. have between 50% and 59.9% fully vaccinated: Virginia at 59.8%, District of Columbia, Colorado, California, Minnesota, Hawaii, Delaware, Pennsylvania, Wisconsin, Florida, Nebraska, Iowa, Illinois, Michigan, South Dakota, Kentucky, Arizona, Kansas, Texas, Nevada, and Utah at 50.0%.
Next up (total population, fully vaccinated according to CDC) are Ohio at 49.8%, Alaska at 49.7%, North Carolina 49.0% and Montana at 48.1%.
 Click on graph for larger image.
This graph shows the daily (columns) and 7 day average (line) of positive tests reported.
Existing Home Sales: Some Regional Differences Appear
by Calculated Risk on 9/23/2021 04:26:00 PM
In the Newsletter I have Existing Home Sales: Some Regional Differences Appear
Excerpt:
For the last year, most housing markets moved together with rapidly falling inventory and sharply increasing house prices. However, in August, about half of these markets saw a month-over-month (MoM) increase in inventory - and the other half saw a decrease - so we might be seeing some regional divergence.

Hotels: Occupancy Rate Down 11.6% Compared to Same Week in 2019
by Calculated Risk on 9/23/2021 01:38:00 PM
Note: The year-over-year occupancy comparisons are easy, since occupancy declined sharply at the onset of the pandemic.
From CoStar: STR: US Hotels Achieve Four-Week Occupancy High
U.S. hotel occupancy reached a four-week high, according to STR‘s latest data through September 18.The following graph shows the seasonal pattern for the hotel occupancy rate using the four week average.
September 12-18, 2021 (percentage change from comparable week in 2019*):
• Occupancy: 63.0% (-11.6%)
• verage daily rate (ADR): $131.04 (-2.6%)
• Revenue per available room (RevPAR): $82.50 (-13.9%)
The gain in occupancy was helped by weekly group demand eclipsing 1 million for the first time since the earliest days of the pandemic. More group demand created a lowering effect on ADR, as group rooms for upper-tier classes are typically priced lower than transient rooms.
emphasis added
 Click on graph for larger image.
The red line is for 2021, black is 2020, blue is the median, dashed purple is 2019, and dashed light blue is for 2009 (the worst year on record for hotels prior to 2020).
Note: Y-axis doesn't start at zero to better show the seasonal change.
With solid leisure travel, the Summer months had decent occupancy - but it is uncertain what will happen in the Fall with business travel - usually weekly occupancy increases to around 70% in the weeks following Labor Day due to renewed business travel.


