 RSS Feed
 by Calculated Risk on 7/26/2021 08:14:00 AM
Monday, July 26, 2021
Seven High Frequency Indicators for the Economy
These indicators are mostly for travel and entertainment. It will interesting to watch these sectors recover as the pandemic subsides.
The TSA is providing daily travel numbers.
This data is as of July 25th.
 Click on graph for larger image.
This data shows the 7-day average of daily total traveler throughput from the TSA for 2019 (Light Blue), 2020 (Blue) and 2021 (Red).
The dashed line is the percent of 2019 for the seven day average.
The 7-day average is down 21.3% from the same day in 2019 (78.7% of 2019). (Dashed line)
There was a slow increase from the bottom - and TSA data has picked up in 2021 - but moved over the last couple of weeks.
The second graph shows the 7-day average of the year-over-year change in diners as tabulated by OpenTable for the US and several selected cities.
IMPORTANT: OpenTable notes: "we’ve updated the data including downloadable dataset from January 1, 2021 onward to compare seated diners from 2021 to 2019, as opposed to year over year." Thanks!
 Thanks to OpenTable for providing this restaurant data:
This data is updated through July 24th, 2021.
This data is "a sample of restaurants on the OpenTable network across all channels: online reservations, phone reservations, and walk-ins. For year-over-year comparisons by day, we compare to the same day of the week from the same week in the previous year."
Note that this data is for "only the restaurants that have chosen to reopen in a given market". Since some restaurants have not reopened, the actual year-over-year decline is worse than shown.
Dining picked up during the holidays, then slumped with the huge winter surge in cases. Dining is generally picking up, but was down 6% in the US (7-day average compared to 2019). Florida and Texas are above 2019 levels.
----- Movie Tickets: Box Office Mojo -----
 This data shows domestic box office for each week and the median for the years 2016 through 2019 (dashed light blue).
 Thanks to OpenTable for providing this restaurant data:
This data is updated through July 24th, 2021.
This data is "a sample of restaurants on the OpenTable network across all channels: online reservations, phone reservations, and walk-ins. For year-over-year comparisons by day, we compare to the same day of the week from the same week in the previous year."
Note that this data is for "only the restaurants that have chosen to reopen in a given market". Since some restaurants have not reopened, the actual year-over-year decline is worse than shown.
Dining picked up during the holidays, then slumped with the huge winter surge in cases. Dining is generally picking up, but was down 6% in the US (7-day average compared to 2019). Florida and Texas are above 2019 levels.
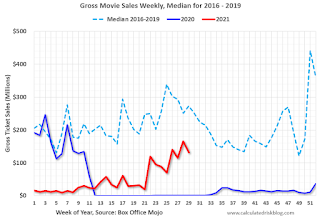
 This data shows domestic box office for each week and the median for the years 2016 through 2019 (dashed light blue).
 Blue is 2020 and Red is 2021.
The data is from BoxOfficeMojo through July 22nd.
Note that the data is usually noisy week-to-week and depends on when blockbusters are released.
Movie ticket sales were at $132 million last week, down about 52% from the median for the week.
Note that the data is usually noisy week-to-week and depends on when blockbusters are released.
Movie ticket sales were at $132 million last week, down about 52% from the median for the week.
 This graph shows the seasonal pattern for the hotel occupancy rate using the four week average.
 The red line is for 2021, black is 2020, blue is the median, dashed purple is 2019, and dashed light blue is for 2009 (the worst year on record for hotels prior to 2020).
Occupancy is well above the horrible 2009 levels and weekend occupancy (leisure) has been solid.
This data is through July 17th. The occupancy rate is down 8.7% compared to the same week in 2019. Note: Occupancy was up year-over-year, since occupancy declined sharply at the onset of the pandemic. However, the 4-week average occupancy is still down from normal levels.
Notes: Y-axis doesn't start at zero to better show the seasonal change.
 This graph, based on weekly data from the U.S. Energy Information Administration (EIA), shows gasoline supplied compared to the same week of 2019.
Blue is for 2020. Red is for 2021.
As of July 16th, gasoline supplied was down 3.9% compared to the same week in 2019.
There have been 3 weeks so far this year when gasoline supplied was up compared to the same week in 2019.
This graph is from Apple mobility. From Apple: "This data is generated by counting the number of requests made to Apple Maps for directions in select countries/regions, sub-regions, and cities." This is just a general guide - people that regularly commute probably don't ask for directions.
There is also some great data on mobility from the Dallas Fed Mobility and Engagement Index. However the index is set "relative to its weekday-specific average over January–February", and is not seasonally adjusted, so we can't tell if an increase in mobility is due to recovery or just the normal increase in the Spring and Summer.
 This data is through July 23rd for the United States and several selected cities.
The graph is the running 7-day average to remove the impact of weekends.
IMPORTANT: All data is relative to January 13, 2020. This data is NOT Seasonally Adjusted. People walk and drive more when the weather is nice, so I'm just using the transit data.
According to the Apple data directions requests, public transit in the 7 day average for the US is at 101% of the January 2020 level.
Strangely, New York City is doing well by this metric, but subway usage in NYC is down sharply (next graph). I'd put much more weight on subway usage!
----- New York City Subway Usage -----
Here is some interesting data on New York subway usage (HT BR).
 This graph is from Todd W Schneider. This is weekly data since 2015.
Here is some interesting data on New York subway usage (HT BR).
 This graph is from Todd W Schneider. This is weekly data since 2015.
 Most weeks are between 30 and 35 million entries, and currently there are over 12 million subway turnstile entries per week - and generally increasing.
This data is through Friday, July 23rd.
Schneider has graphs for each borough, and links to all the data sources.
He notes: "Data updates weekly from the MTA’s public turnstile data, usually on Saturday mornings".
This data is through Friday, July 23rd.
Schneider has graphs for each borough, and links to all the data sources.
He notes: "Data updates weekly from the MTA’s public turnstile data, usually on Saturday mornings".
Sunday, July 25, 2021
Monday: New Home Sales
by Calculated Risk on 7/25/2021 08:06:00 PM
Weekend:
• Schedule for Week of July 25, 2021
• FOMC Preview: Probably Too Soon for Hints on Tapering
Monday:
• At 10:00 AM ET, New Home Sales for June from the Census Bureau. The consensus is for 800 thousand SAAR, up from 769 thousand in May.
• At 10:30 AM, Dallas Fed Survey of Manufacturing Activity for July.
From CNBC: Pre-Market Data and Bloomberg futures S&P 500 and DOW futures are mostly unchanged (fair value).
Oil prices were up over the last week with WTI futures at $72.07 per barrel and Brent at $74.10 per barrel. A year ago, WTI was at $41, and Brent was at $43 - so WTI oil prices are UP about 75% year-over-year (oil prices collapsed at the beginning of the pandemic).
Here is a graph from Gasbuddy.com for nationwide gasoline prices. Nationally prices are at $3.14 per gallon. A year ago prices were at $2.15 per gallon, so gasoline prices are up $0.99 per gallon year-over-year.
July 25th COVID-19, New Cases, Hospitalizations, Vaccinations
by Calculated Risk on 7/25/2021 03:54:00 PM
Note: Cases and Deaths not updated on Sundays.
The 7-day average cases is the highest since May 3rd.
The 7-day average hospitalizations is the highest since May 21st.
This data is from the CDC.
According to the CDC, on Vaccinations.
Total doses administered: 341,818,968, as of a week ago 337,740,358. Average doses last week: 0.58 million per day.
KUDOS to the residents of the 20 states and D.C. that have achieved the 70% goal (percent over 18 with at least one dose): Vermont, Hawaii, Massachusetts and Connecticut are at 80%+, and Maine, New Mexico, New Jersey, Rhode Island, Pennsylvania, California, Maryland, Washington, New Hampshire, New York, Illinois, Virginia, Delaware, Minnesota, Oregon, Colorado and D.C. are all over 70%.
According to the CDC, on Vaccinations.
Total doses administered: 341,818,968, as of a week ago 337,740,358. Average doses last week: 0.58 million per day.
| COVID Metrics | ||||
|---|---|---|---|---|
| Today | Yesterday | Week Ago | Goal | |
| Percent over 18, One Dose | 69.0% | 68.8% | 68.2% | ≥70.0%1,2 |
| Fully Vaccinated✅ (millions) | 163.0 | 162.7 | 161.2 | ≥1601 |
| New Cases per Day3🚩 | 47,455 | 44,063 | 30,682 | ≤5,0002 |
| Hospitalized3🚩 | 24,252 | 23,654 | 17,724 | ≤3,0002 |
| Deaths per Day3🚩 | 253 | 249 | 216 | ≤502 |
| 1 America's Short Term Goals, 2my goals to stop daily posts, 37 day average for Cases, Hospitalized, and Deaths 🚩 Increasing 7 day average week-over-week for Cases, Hospitalized, and Deaths ✅ Goal met (even if late). | ||||
KUDOS to the residents of the 20 states and D.C. that have achieved the 70% goal (percent over 18 with at least one dose): Vermont, Hawaii, Massachusetts and Connecticut are at 80%+, and Maine, New Mexico, New Jersey, Rhode Island, Pennsylvania, California, Maryland, Washington, New Hampshire, New York, Illinois, Virginia, Delaware, Minnesota, Oregon, Colorado and D.C. are all over 70%.
Next up are Florida at 67.6%, Utah at 67.1%, Wisconsin at 66.8%, Nebraska at 66.7%, South Dakota at 65.7%, Kansas at 65.6%, Iowa at 65.1%, Nevada at 64.6% and Arizona at 63.9%.
 Click on graph for larger image.
This graph shows the daily (columns) and 7 day average (line) of hospitalizations reported.
This data is from the CDC.
FOMC Preview: Probably Too Soon for Hints on Tapering
by Calculated Risk on 7/25/2021 07:59:00 AM
Expectations are there will be no change to rate policy when the FOMC meets on Tuesday and Wednesday this week.
Analysts will be looking for any hints as to when the Fed will start to taper asset purchases, although it is probably too early - especially given possible economic downside risks due to the resurgence in COVID cases - for the Fed to drop hints on tapering this week.
Here are some comments from Goldman Sachs economists on the timing of tapering:
Fed officials have said that they intend to signal that tapering is coming “well in advance,” a phrase they also used in reference to the start of balance sheet runoff in 2017. That precedent suggests that “well in advance” means two meetings worth of hints before the formal announcement, consistent with our expectation of a first hint in September, a second hint in November, and a formal announcement of tapering in December.Analysts will also be looking for comments on inflation, although the Fed is probably not too concerned with inflation right now. Some of the recent increase in inflation was due to base effects (prices declined at the beginning of the pandemic), and some probably due to transitory effects related to supply bottlenecks.
Note: No projections will be released at this meeting. However, for review, here are the June FOMC projections.
Wall Street forecasts are for GDP to increase at a 8.6% annual rate in Q2 (to be released this coming Thursday). This is lower than most forecasts when the Fed last met in June.
So the FOMC projections for 2021 may now be a little on the high side compared to Wall Street.
1 Projections of change in real GDP and inflation are from the fourth quarter of the previous year to the fourth quarter of the year indicated.
| GDP projections of Federal Reserve Governors and Reserve Bank presidents, Change in Real GDP1 | ||||
|---|---|---|---|---|
| Projection Date | 2021 | 2022 | 2023 | |
| June 2021 | 6.8 to 7.3 | 2.8 to 3.8 | 2.0 to 2.5 | |
| Mar 2021 | 5.8 to 6.6 | 3.0 to 3.8 | 2.0 to 2.5 | |
Note that the unemployment rate doesn't remotely capture the economic damage to the labor market. Not only are there 3.7 million more people currently unemployed than prior to the pandemic, over 3.4 million people have left the labor force since February 2020. And millions more are being supported by various provisions of the disaster relief acts.
2 Projections for the unemployment rate are for the average civilian unemployment rate in the fourth quarter of the year indicated.
The decline in the unemployment rate depends on both job growth, and the participation rate. A strong labor market will probably encourage people to return to the labor force, and the improvements in the unemployment rate might be slower than some expect.
As of May 2021, PCE inflation was up 3.9% from May 2020.
PCE core inflation was up 3.4% in May year-over-year.
| Unemployment projections of Federal Reserve Governors and Reserve Bank presidents, Unemployment Rate2 | ||||
|---|---|---|---|---|
| Projection Date | 2021 | 2022 | 2023 | |
| June 2021 | 4.4 to 4.8 | 3.5 to 4.0 | 3.2 to 3.8 | |
| Mar 2021 | 4.2 to 4.7 | 3.6 to 4.0 | 3.2 to 3.8 | |
The decline in the unemployment rate depends on both job growth, and the participation rate. A strong labor market will probably encourage people to return to the labor force, and the improvements in the unemployment rate might be slower than some expect.
As of May 2021, PCE inflation was up 3.9% from May 2020.
| Inflation projections of Federal Reserve Governors and Reserve Bank presidents, PCE Inflation1 | ||||
|---|---|---|---|---|
| Projection Date | 2021 | 2022 | 2023 | |
| June 2021 | 3.1 to 3.5 | 1.9 to 2.3 | 2.0 to 2.2 | |
| Mar 2021 | 2.2 to 2.4 | 1.8 to 2.1 | 2.0 to 2.2 | |
PCE core inflation was up 3.4% in May year-over-year.
| Core Inflation projections of Federal Reserve Governors and Reserve Bank presidents, Core Inflation1 | ||||
|---|---|---|---|---|
| Projection Date | 2021 | 2022 | 2023 | |
| June 2021 | 2.9 to 3.1 | 1.9 to 2.3 | 2.0 to 2.2 | |
| Mar 2021 | 2.0 to 2.3 | 1.9 to 2.1 | 2.0 to 2.2 | |
Saturday, July 24, 2021
July 24th COVID-19, New Cases, Hospitalizations, Vaccinations
by Calculated Risk on 7/24/2021 05:13:00 PM
The 7-day average cases is the highest since May 3rd.
The 7-day average hospitalizations is the highest since May 22nd.
This data is from the CDC.
According to the CDC, on Vaccinations.
Total doses administered: 341,039,972, as of a week ago 337,239,448. Average doses last week: 0.54 million per day.
KUDOS to the residents of the 20 states and D.C. that have achieved the 70% goal (percent over 18 with at least one dose): Vermont, Hawaii, Massachusetts and Connecticut are at 80%+, and Maine, New Mexico, New Jersey, Rhode Island, Pennsylvania, California, Maryland, Washington, New Hampshire, New York, Illinois, Virginia, Delaware, Minnesota, Oregon, Colorado and D.C. are all over 70%.
According to the CDC, on Vaccinations.
Total doses administered: 341,039,972, as of a week ago 337,239,448. Average doses last week: 0.54 million per day.
| COVID Metrics | ||||
|---|---|---|---|---|
| Today | Yesterday | Week Ago | Goal | |
| Percent over 18, One Dose | 68.8% | 68.7% | 68.1% | ≥70.0%1,2 |
| Fully Vaccinated✅ (millions) | 162.7 | 162.4 | 161.0 | ≥1601 |
| New Cases per Day3🚩 | 47,455 | 44,063 | 30,682 | ≤5,0002 |
| Hospitalized3🚩 | 23,616 | 22,468 | 16,960 | ≤3,0002 |
| Deaths per Day3🚩 | 253 | 249 | 216 | ≤502 |
| 1 America's Short Term Goals, 2my goals to stop daily posts, 37 day average for Cases, Hospitalized, and Deaths 🚩 Increasing 7 day average week-over-week for Cases, Hospitalized, and Deaths ✅ Goal met (even if late). | ||||
KUDOS to the residents of the 20 states and D.C. that have achieved the 70% goal (percent over 18 with at least one dose): Vermont, Hawaii, Massachusetts and Connecticut are at 80%+, and Maine, New Mexico, New Jersey, Rhode Island, Pennsylvania, California, Maryland, Washington, New Hampshire, New York, Illinois, Virginia, Delaware, Minnesota, Oregon, Colorado and D.C. are all over 70%.
Next up are Florida at 67.2%, Utah at 67.1%, Wisconsin at 66.7%, Nebraska at 66.7%, South Dakota at 65.6%, Iowa at 65.1%, Nevada at 64.4% and Arizona at 63.8%.
 Click on graph for larger image.
This graph shows the daily (columns) and 7 day average (line) of positive tests reported.
Almost 65,000 new cases were reported so far today.
This data is from the CDC.
Schedule for Week of July 25, 2021
by Calculated Risk on 7/24/2021 08:11:00 AM
The key report this week is the advance estimate of Q2 GDP.
Other key reports include June New Home Sales, Personal Income and Outlays for June, and Case-Shiller house prices for May.
For manufacturing, the July Richmond and Dallas Fed manufacturing surveys will be released.
The FOMC meets this week, and no change to policy is expected.
 10:00 AM: New Home Sales for June from the Census Bureau.
 This graph shows New Home Sales since 1963. The dashed line is the sales rate for last month.
The consensus is for 800 thousand SAAR, up from 769 thousand in May.
10:30 AM: Dallas Fed Survey of Manufacturing Activity for July.
8:30 AM: Durable Goods Orders for June from the Census Bureau. The consensus is for a 2.1% increase in durable goods orders.
 9:00 AM: S&P/Case-Shiller House Price Index for May.
This graph shows the year-over-year change in the seasonally adjusted National Index, Composite 10 and Composite 20 indexes through the most recent report (the Composite 20 was started in January 2000).
The consensus is for a 16.3% year-over-year increase in the Comp 20 index for May.
9:00 AM: FHFA House Price Index for May. This was originally a GSE only repeat sales, however there is also an expanded index.
10:00 AM: Richmond Fed Survey of Manufacturing Activity for July. This is the last of the regional surveys for July.
10:00 AM: The Q2 Housing Vacancies and Homeownership report from the Census Bureau.
7:00 AM ET: The Mortgage Bankers Association (MBA) will release the results for the mortgage purchase applications index.
2:00 PM: FOMC Meeting Announcement. No change to policy is expected at this meeting.
2:30 PM: Fed Chair Jerome Powell holds a press briefing following the FOMC announcement.
8:30 AM: Gross Domestic Product, 2nd quarter (advance estimate), and annual update. The consensus is that real GDP increased 8.6% annualized in Q2, up from 6.4% in Q1.
8:30 AM: The initial weekly unemployment claims report will be released. The consensus is for a decrease to 400 thousand from 419 thousand last week.
10:00 AM: Pending Home Sales Index for June. The consensus is for a 0.5% increase in the index.
8:30 AM ET: Personal Income and Outlays, June 2020. The consensus is for a 0.3% decrease in personal income, and for a 0.7% increase in personal spending. And for the Core PCE price index to increase 0.6%.
9:45 AM: Chicago Purchasing Managers Index for July.
10:00 AM: University of Michigan's Consumer sentiment index (Final for July). The consensus is for a reading of 80.8.
Friday, July 23, 2021
July 23rd COVID-19, New Cases, Hospitalizations, Vaccinations
by Calculated Risk on 7/23/2021 04:50:00 PM
The 7-day average cases is the highest since May 6th.
The 7-day average hospitalizations is the highest since May 25th.
This data is from the CDC.
According to the CDC, on Vaccinations.
Total doses administered: 340,363,922, as of a week ago 336,604,158. Average doses last week: 0.54 million per day.
KUDOS to the residents of the 20 states and D.C. that have achieved the 70% goal (percent over 18 with at least one dose): Vermont, Hawaii, Massachusetts and Connecticut are at 80%+, and Maine, New Mexico, New Jersey, Rhode Island, Pennsylvania, California, Maryland, Washington, New Hampshire, New York, Illinois, Virginia, Delaware, Minnesota, Oregon, Colorado and D.C. are all over 70%.
According to the CDC, on Vaccinations.
Total doses administered: 340,363,922, as of a week ago 336,604,158. Average doses last week: 0.54 million per day.
| COVID Metrics | ||||
|---|---|---|---|---|
| Today | Yesterday | Week Ago | Goal | |
| Percent over 18, One Dose | 68.7% | 68.6% | 68.0% | ≥70.0%1,2 |
| Fully Vaccinated✅ (millions) | 162.4 | 162.2 | 160.7 | ≥1601 |
| New Cases per Day3🚩 | 43,729 | 40,246 | 28,964 | ≤5,0002 |
| Hospitalized3🚩 | 22,246 | 21,269 | 16,297 | ≤3,0002 |
| Deaths per Day3🚩 | 250 | 223 | 211 | ≤502 |
| 1 America's Short Term Goals, 2my goals to stop daily posts, 37 day average for Cases, Hospitalized, and Deaths 🚩 Increasing 7 day average week-over-week for Cases, Hospitalized, and Deaths ✅ Goal met (even if late). | ||||
KUDOS to the residents of the 20 states and D.C. that have achieved the 70% goal (percent over 18 with at least one dose): Vermont, Hawaii, Massachusetts and Connecticut are at 80%+, and Maine, New Mexico, New Jersey, Rhode Island, Pennsylvania, California, Maryland, Washington, New Hampshire, New York, Illinois, Virginia, Delaware, Minnesota, Oregon, Colorado and D.C. are all over 70%.
Next up are Utah at 67.1%, Florida at 67.1%, Wisconsin at 66.7%, Nebraska at 66.4%, South Dakota at 65.5%, Iowa at 65.0% and Nevada at 64.2%.
 Click on graph for larger image.
This graph shows the daily (columns) and 7 day average (line) of positive tests reported.
Almost 65,000 new cases were reported so far today.
This data is from the CDC.
July Vehicle Sales Forecast: "Sales to Continue Free-Fall"
by Calculated Risk on 7/23/2021 02:46:00 PM
From WardsAuto: July U.S. Light-Vehicle Sales to Continue Free-Fall from Springtime Peak (pay content)
Wards notes low inventories and supply issues (mircochips) are impacting sales.
 Click on graph for larger image.
This graph shows actual sales from the BEA (Blue), and Wards forecast for July (Red).
The Wards forecast of 14.8 million SAAR, would be down about 4% from last month, and up 1% from a year ago (sales were recovering in June 2020 from the depths of the pandemic).
REALTORS® Confidence Index Survey June 2021
by Calculated Risk on 7/23/2021 11:40:00 AM
Some interesting information from the REALTORS® Confidence Index Survey June 2021
Several metrics indicate that demand is softening although the market is still broadly strong. With limited supply in the market, homes typically sold within 17 days (24 days one year ago), as buyer competition continues. However, the REALTORS® Buyer Traffic Index decreased from 77 in May 2021 to 71 (moderately strong conditions) in June 2021 while the REALTORS® Seller Traffic Index remains below 50 which is “weak” traffic compared to the level one year ago. On average, a home sold had more than 4 offers, slightly lower than the average of 5 offers in last month’s survey. REALTORS® expect home prices in the next three months to increase nearly 4% from one year ago compared to 5% outlook in last month’s survey. Respondents expect sales in the next three months to increase nearly 1% from last year’s sales level compared to the 2% outlook in last month’s survey.
emphasis added
 Click on graph for larger image.
This map, from the June NAR report, shows buyer traffic is still "moderately strong" to "very strong" just about everywhere.
However this is less demand than a few months ago.
As the NAR noted: "demand is softening although the market is still broadly strong".
 The second map is from the April report.
In April, buyer traffic was very strong just about everywhere.
There has also been a shift in seller traffic, with more traffic in many states (compare map from April on page 3 to the map from June also on page 3).
Q2 GDP Forecasts: Around 8%
by Calculated Risk on 7/23/2021 11:19:00 AM
The BEA will release the advance estimate of Q2 GDP next Thursday. The consensus forecast is for real GDP to increase 8.2% in Q2, from Q1, on a seasonally adjusted annual rate basis (SAAR).
From BofA:
We expect growth of 8.5% qoq saar in 2Q from 6.4% qoq saar in 1Q. [July 23 estimate]From Goldman Sachs:
emphasis added
We left our Q2 GDP tracking estimate unchanged at +8¼% (qoq ar). [July 22 estimate]From the NY Fed Nowcasting Report
The New York Fed Staff Nowcast stands at 3.2% for 2021:Q2 and 4.1% for 2021:Q3. [July 23 estimate]And from the Altanta Fed: GDPNow
The GDPNow model estimate for real GDP growth (seasonally adjusted annual rate) in the second quarter of 2021 is 7.6 percent on July 20, up from 7.5 percent on July 16. [July 20 estimate]


