by Calculated Risk on 7/14/2021 04:11:00 PM
Wednesday, July 14, 2021
July 14th COVID-19, New Cases, Hospitalizations, Vaccinations
According to the CDC, on Vaccinations.
Total doses administered: 335,487,779, as of a week ago 331,651,464. Average doses last week: 0.55 million per day.
| COVID Metrics | ||||
|---|---|---|---|---|
| Today | Yesterday | Week Ago | Goal | |
| Percent over 18, One Dose | 67.8% | 67.7% | 67.2% | ≥70.0%1,2 |
| Fully Vaccinated✅ (millions) | 160.1 | 159.7 | 157.9 | ≥1601 |
| New Cases per Day3🚩 | 24,141 | 21,379 | 14,554 | ≤5,0002 |
| Hospitalized3🚩 | 15,069 | 14,308 | 12,419 | ≤3,0002 |
| Deaths per Day3🚩 | 206 | 176 | 161 | ≤502 |
| 1 America's Short Term Goals, 2my goals to stop daily posts, 37 day average for Cases, Hospitalized, and Deaths 🚩 Increasing 7 day average week-over-week for Cases, Hospitalized, and Deaths ✅ Goal met (even if late). | ||||
KUDOS to the residents of the 20 states and D.C. that have already achieved the 70% goal (percent over 18 with at least one dose): Vermont, Hawaii, Massachusetts and Connecticut are at 80%+, and Maine, New Mexico, New Jersey, Rhode Island, Pennsylvania, California, Maryland, Washington, New Hampshire, New York, Illinois, Virginia, Delaware, Minnesota, Oregon, Colorado and D.C. are all over 70%.
Next up are Utah at 66.2%, Wisconsin at 66.1%, Florida at 65.9%, Nebraska at 65.9%, South Dakota at 64.8%, and Iowa at 64.4%.
 Click on graph for larger image.
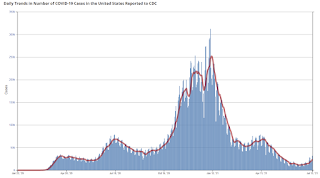
This graph shows the daily (columns) and 7 day average (line) of positive tests reported.
This data is from the CDC.
Houston Real Estate in June: Sales Up 17% YoY, Inventory Down 31% YoY
by Calculated Risk on 7/14/2021 03:07:00 PM
I'm tracking sales and inventory for many local markets.
From the HAR: Houston’s Real Estate Buying Blitz Persists in June
Houston real estate held to record territory in June with buyers continuing to seize upon historically low interest rates as they purchased homes from among a limited supply. Despite the strong buying activity, the pace was slightly slower in the year-over-year comparison.Single family inventory declined 31.3% year-over-year from 35,281 in June 2020 to 24,225 in June 2021. This is just 1.5 months of supply compared to 3.0 months in June 2020.
According to the latest Houston Association of Realtors (HAR) Market Update, single-family homes sales were up 13.6 percent compared to last June, with 10,638 units sold versus 9,362 a year earlier. That becomes the market’s thirteenth consecutive positive month of sales. On a year-to-date basis, home sales remain 25.9 percent ahead of 2020’s record pace.
Once again, homes priced from $750,000 and above dominated in sales volume with a 136.5 percent year-over-year increase. That was followed by the $500,000 to $750,000 segment, which soared 87.0 percent. The surge in high-dollar homebuying again pushed pricing to record-setting levels. The single-family home average price rose 23.7 percent to $395,316 and the median price increased 20.0 percent to $314,500.
Sales of all property types totaled 13,090 – the greatest volume of all time. That is up 16.9 percent from June 2020. Total dollar volume for the month climbed 43.8 percent to a record-setting $4.8 billion.
“The Houston housing market is in overdrive right now, and we know anecdotally that out-of-town investors have contributed to the frenzy,” said HAR Chairman Richard Miranda with Keller Williams Platinum. “We saw similar investment activity following Hurricane Harvey, and within a few months, the market stabilized. We expect stability to return this time around, so anyone in the market for a home who is frustrated by current market conditions needs to be patient.”
emphasis added
Note that inventory was up 7.2% compared to the previous month.
Maryland Real Estate in June: Sales Up 24% YoY, Inventory Down 45% YoY
by Calculated Risk on 7/14/2021 02:30:00 PM
Note: I'm tracking data for many local markets around the U.S. I think it is especially important to watch inventory this year.
From the Maryland Realtors for the entire state:
Closed sales in June 2021 were 10,790, up 24.2% from 8,686 in June 2020.
Active Listings in June 2021 were 8,550, down 45.0% from 15,558 in June 2020.
Inventory in June was up 14.2% from last month, and up 38% from the all time low in March 2021.
Months of Supply was 1.0 Months in June 2021, compared to 2.2 Months in June 2020.
Rhode Island Real Estate in June: Sales Up 31% YoY, Inventory Down 33% YoY
by Calculated Risk on 7/14/2021 11:51:00 AM
Note: I'm tracking data for many local markets around the U.S. I think it is especially important to watch inventory this year.
For for the entire state of Rhode Island:
Closed sales (single family and condos) in June 2021 were 1,473, up 31.2% from 1,123 in June 2020.
Active Listings (single family and condos) in June 2021 were 1,985, down 33.1% from 2,966 in June 2020.
Inventory in June was up 74% from last month.
Fed Chair Powell: Semiannual Monetary Policy Report to the Congress
by Calculated Risk on 7/14/2021 10:22:00 AM
This testimony will be live here at 12PM ET.
From Fed Chair Powell: Semiannual Monetary Policy Report to the Congress. An excerpt on inflation:
Inflation has increased notably and will likely remain elevated in coming months before moderating. Inflation is being temporarily boosted by base effects, as the sharp pandemic-related price declines from last spring drop out of the 12-month calculation. In addition, strong demand in sectors where production bottlenecks or other supply constraints have limited production has led to especially rapid price increases for some goods and services, which should partially reverse as the effects of the bottlenecks unwind. Prices for services that were hard hit by the pandemic have also jumped in recent months as demand for these services has surged with the reopening of the economy.
First Look at 2022 Cost-Of-Living Adjustments and Maximum Contribution Base
by Calculated Risk on 7/14/2021 10:12:00 AM
The BLS reported yesterday morning:
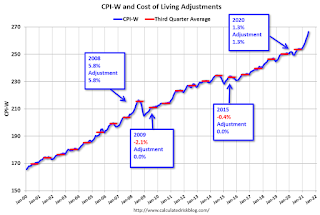
The Consumer Price Index for Urban Wage Earners and Clerical Workers (CPI-W) increased 6.1 percent over the last 12 months to an index level of 266.412 (1982-84=100). For the month, the index rose 1.1 percent prior to seasonal adjustment.CPI-W is the index that is used to calculate the Cost-Of-Living Adjustments (COLA). The calculation dates have changed over time (see Cost-of-Living Adjustments), but the current calculation uses the average CPI-W for the three months in Q3 (July, August, September) and compares to the average for the highest previous average of Q3 months. Note: this is not the headline CPI-U, and is not seasonally adjusted (NSA).
• In 2020, the Q3 average of CPI-W was 253.412.
The 2020 Q3 average was the highest Q3 average, so we only have to compare Q3 this year to last year.
 Click on graph for larger image.
This graph shows CPI-W since January 2000. The red lines are the Q3 average of CPI-W for each year.
Note: The year labeled for the calculation, and the adjustment is effective for December of that year (received by beneficiaries in January of the following year).
CPI-W was up 6.1% year-over-year in June, and although this is very early - we need the data for July, August and September - my current guess is COLA will probably be around 5.5% this year, the largest increase since 5.8% in 2008 - and it is possible this will be the largest increase since 1982 (7.4%).
Contribution and Benefit Base
The contribution base will be adjusted using the National Average Wage Index. This is based on a one year lag. The National Average Wage Index is not available for 2020 yet, but wages probably increased again in 2020. If wages increased the same as in 2019, then the contribution base next year will increase to around $148,200 in 2022, from the current $142,800.
Remember - this is an early look. What matters is average CPI-W, NSA, for all three months in Q3 (July, August and September).
MBA: Mortgage Applications Increase in Latest Weekly Survey
by Calculated Risk on 7/14/2021 07:00:00 AM
From the MBA: Mortgage Applications Increase in Latest MBA Weekly Survey
Mortgage applications increased 16.0 percent from one week earlier, according to data from the Mortgage Bankers Association’s (MBA) Weekly Mortgage Applications Survey for the week ending July 9, 2021. This week’s results include an adjustment for the Fourth of July holiday.
... The Refinance Index increased 20 percent from the previous week and was 29 percent lower than the same week one year ago. The seasonally adjusted Purchase Index increased 8 percent from one week earlier. The unadjusted Purchase Index decreased 13 percent compared with the previous week and was 29 percent lower than the same week one year ago.
“Overall applications climbed last week, driven heavily by increased refinancing as rates dipped again. Treasury yields have trended lower over the past month as investors remained concerned about the COVID-19 variant and slowing economic growth,” said Joel Kan, MBA's Associate Vice President of Economic and Industry Forecasting. “Mortgage rates fell for the second consecutive week as a result, with the 30-year fixed rate hitting 3.09 percent, its lowest level since February 2021. Refinance applications increased over 20 percent last week after adjusting for the July 4th holiday, aided by a 23 percent increase in conventional refinance applications. Also, there may have been a delayed spillover of applications from the previous week, when rates also decreased but there was not much of response in terms of refinance applications.”
Added Kan: “Purchase applications increased last week, but average loan sizes decreased to their lowest level since January 2021. We continue to see ebbs and flows as housing demand remains strong but for-sale inventory remains low. However, lower rates may be helping some home buyers close on their purchases, especially first-time home buyers. The year-over-year comparisons were down significantly for both purchase and refinance applications, as they were relative to a non-holiday week in 2020.”
...
The average contract interest rate for 30-year fixed-rate mortgages with conforming loan balances ($548,250 or less) decreased to 3.09 percent from 3.15 percent, with points decreasing to 0.37 from 0.38 (including the origination fee) for 80 percent loan-to-value ratio (LTV) loans.
emphasis added
 Click on graph for larger image.
The first graph shows the refinance index since 1990.
With low rates, the index remains elevated, and increased last week as rates declined.
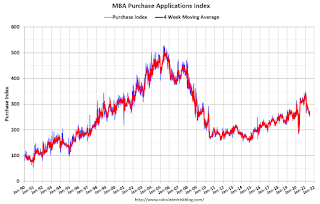
The second graph shows the MBA mortgage purchase index
 According to the MBA, purchase activity is down 29% year-over-year unadjusted.
Note: The year ago comparisons for the unadjusted purchase index are now difficult since purchase activity picked up in late May 2020.
Note: Red is a four-week average (blue is weekly).
Tuesday, July 13, 2021
Wednesday: PPI, Fed Chair Powell Testimony, Beige Book
by Calculated Risk on 7/13/2021 09:00:00 PM
Wednesday:
• At 7:00 AM ET, The Mortgage Bankers Association (MBA) will release the results for the mortgage purchase applications index.
• At 8:30 AM, The Producer Price Index for June from the BLS. The consensus is for a 0.5% increase in PPI, and a 0.5% increase in core PPI.
• At 12:00 PM, Testimony, Fed Chair Jerome Powell, Semiannual Monetary Policy Report to the Congress, Before the U.S. House Committee on Financial Services
• At 2:00 PM, the Federal Reserve Beige Book, an informal review by the Federal Reserve Banks of current economic conditions in their Districts.
A Few Excerpts from a Local Commercial Real Estate Report: "Good news is construction activity has all but stopped"
by Calculated Risk on 7/13/2021 04:54:00 PM
Voit Real Estate Services released their Q2 reports on Commercial Real Estate (CRE) in SoCal. Here are a few excerpts from the Orange County Office report:
"The Orange County office market struggled again in 2Q. It had already been slowing before the pandemic hit, and by virtue of the higher employee density and multi-tenant configuration of office product, the office sector was hit harder by COVID than other sectors. Vacancy and availability both moved higher, and net absorption remained in negative territory. Average asking lease rates were relatively flat, but they alone do not tell the full story, as landlord concessions have risen sharply and are not reflected in market metrics. Office tenants are still trying to sort out how to fold their workforces back into the office, and that has delayed decision-making regarding relocations and renewals.
...
The vacancy rate in Orange County rose to 13.76%, up 61 basis points in 2Q. That came on top of a 116-basis-point spike in 1Q. The increase was expected given how many moves have been put on hold to re-evaluate space utilization. Class A product is under the most stress. Vacancy in those buildings rose to 18.28% in 2Q, compared with 10.96% for Class B and just 8.75% for Class C.
...
Fewer relocations and an increase in short-term renewals significantly impacted net absorption in 1Q, and the same held true in 2Q. Net absorption was in negative territory again in 2Q, posting a net loss of 512,502 SF, after recording a loss of more than 1.2 MSF in the opening quarter. Consistent negative absorption points to a future increase in vacancy.
...
The good news is that construction activity has all but stopped for the moment, which gives the market a chance to reabsorb existing unoccupied space and clear off some of the lower-priced sublease space. Just 439,206 SF of office space was in the construction queue as 2Q ended, all of it in one project in Costa Mesa, The Press. Another 1.7 MSF of space is in the planning stage but is not expected to get underway until market conditions improve."
emphasis added
July 13th COVID-19, New Cases, Hospitalizations, Vaccinations
by Calculated Risk on 7/13/2021 03:38:00 PM
According to the CDC, on Vaccinations.
Total doses administered: 334,942,236, as of a week ago 331,214,347. Average doses last week: 0.53 million per day.
| COVID Metrics | ||||
|---|---|---|---|---|
| Today | Yesterday | Week Ago | Goal | |
| Percent over 18, One Dose | 67.7% | 67.7% | 67.1% | ≥70.0%1,2 |
| Fully Vaccinated (millions) | 159.7 | 159.5 | 157.6 | ≥1601 |
| New Cases per Day3🚩 | 21,420 | 20,100 | 14,981 | ≤5,0002 |
| Hospitalized3🚩 | 14,308 | 12,831 | 11,418 | ≤3,0002 |
| Deaths per Day3🚩 | 194 | 176 | 163 | ≤502 |
| 1 America's Short Term Goals, 2my goals to stop daily posts, 37 day average for Cases, Hospitalized, and Deaths 🚩 Increasing 7 day average week-over-week for Cases, Hospitalized, and Deaths | ||||
KUDOS to the residents of the 20 states and D.C. that have already achieved the 70% goal (percent over 18 with at least one dose): Vermont, Hawaii, Massachusetts and Connecticut are at 80%+, and Maine, New Mexico, New Jersey, Rhode Island, Pennsylvania, California, Maryland, Washington, New Hampshire, New York, Illinois, Virginia, Delaware, Minnesota, Oregon, Colorado and D.C. are all over 70%.
Next up are Wisconsin at 66.1%, Florida at 65.9%, Nebraska at 65.9%, Utah at 65.2%, South Dakota at 64.8%, and Iowa at 64.4%.
 Click on graph for larger image.
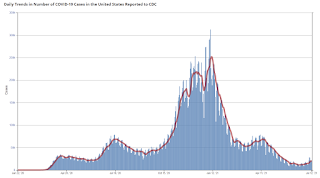
This graph shows the daily (columns) and 7 day average (line) of positive tests reported.
This data is from the CDC.


