by Calculated Risk on 7/13/2021 01:49:00 PM
Tuesday, July 13, 2021
Minnesota Real Estate in June: Sales Up 13% YoY, Inventory Down 41% YoY
Note: I'm tracking data for many local markets around the U.S. I think it is especially important to watch inventory this year.
From the Minnesota Realtors®:
Total Residential Units Sold in June 2021 were 10,386, up 12.9% from 9,203 in June 2020.
Active Residential Listings in June 2021 were 10,227, down 40.8% from 17,285 in June 2020.
Months of Supply was 1.2 Months in June 2021, compared to 2.4 Months in June 2020.

This graph from the Minnesota Realtors® shows inventory in Minnesota since 2012. Inventory had been trending down, and then was somewhat flat for a few years, and then declined significantly during the pandemic.
Active inventory was up 14.2% from the previous month, and up 24.6% seasonally from the all time low in February 2021. Usually, at this time of the year, we'd expect active inventory of around 23,000 in Minnesota, so current inventory is still extremely low.
Colorado Real Estate in June: Sales Up 9% YoY, Inventory Down 59% YoY
by Calculated Risk on 7/13/2021 01:01:00 PM
Note: I'm tracking data for many local markets around the U.S. I think it is especially important to watch inventory this year.
From the Colorado Association of REALTORS® for the entire state:
Closed sales for Single Family and Townhouse-Condo in June 2021 were 13,014, up 8.9% from 11,952 in June 2020.
Active Listings for Single Family and Townhouse-Condo in June 2021 were 9,191, down 58.7% from 22,230 in June 2020.
Inventory in June was up 7.7% from last month.
Months of Supply was 0.8 Months in June 2021, compared to 2.4 Months in June 2020.
Cleveland Fed: Key Measures Show Inflation Increased in June
by Calculated Risk on 7/13/2021 11:08:00 AM
The Cleveland Fed released the median CPI and the trimmed-mean CPI this morning:
According to the Federal Reserve Bank of Cleveland, the median Consumer Price Index rose 0.2% June. The 16% trimmed-mean Consumer Price Index rose 0.5% in June. "The median CPI and 16% trimmed-mean CPI are measures of core inflation calculated by the Federal Reserve Bank of Cleveland based on data released in the Bureau of Labor Statistics’ (BLS) monthly CPI report".
Note: The Cleveland Fed released the median CPI details for June here. Used cars and trucks were up 231% annualized.

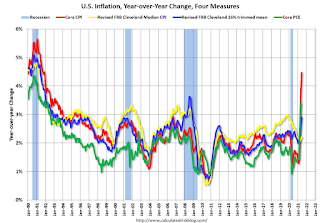
This graph shows the year-over-year change for these four key measures of inflation. On a year-over-year basis, the median CPI rose 2.2%, the trimmed-mean CPI rose 2.9%, and the CPI less food and energy rose 4.5%. Core PCE is for May and increased 3.4% year-over-year.
Second Home Market: South Lake Tahoe in June
by Calculated Risk on 7/13/2021 10:12:00 AM
Four months ago, from Jann Swanson at MortgageNewsDaily: Fannie Warns Lenders on Investment Properties and 2nd Homes.
I'm looking at data for some second home markets - and will track those markets to see if there is an impact from the lending changes.
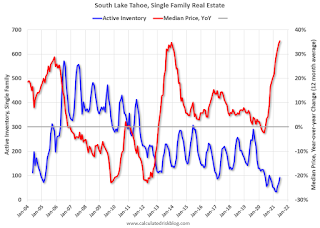
This graph is for South Lake Tahoe since 2004 through June 2021, and shows inventory (blue), and the year-over-year (YoY) change in the median price (12 month average).
Note: The median price is distorted by the mix, but this is the available data.

Following the housing bubble, prices declined for several years in South Lake Tahoe, with the median price falling about 50% from the bubble peak.
Note that inventory was high while prices were declining - and significantly lower inventory in 2012 suggested the bust was over. (Tracking inventory helped me call the bottom for housing way back in February 2012, see:The Housing Bottom is Here)
Currently inventory is still very low, but solidly above the record low set three months ago, and prices are up sharply YoY. This will be interesting to watch.
BLS: CPI increased 0.9% in June, Core CPI increased 0.9%
by Calculated Risk on 7/13/2021 08:31:00 AM
The Consumer Price Index for All Urban Consumers (CPI-U) increased 0.9 percent in June on a seasonally adjusted basis after rising 0.6 percent in May, the U.S. Bureau of Labor Statistics reported today. This was the largest 1-month change since June 2008 when the index rose 1.0 percent. Over the last 12 months, the all items index increased 5.4 percent before seasonal adjustment; this was the largest 12-month increase since a 5.4-percent increase for the period ending August 2008.CPI and core CPI were well above expectations. I'll post a graph later today after the Cleveland Fed releases the median and trimmed-mean CPI.
The index for used cars and trucks continued to rise sharply, increasing 10.5 percent in June. This increase accounted for more than one-third of the seasonally adjusted all items increase. The food index increased 0.8 percent in June, a larger increase than the 0.4-percent increase reported for May. The energy index increased 1.5 percent in June, with the gasoline index rising 2.5 percent over the month.
The index for all items less food and energy rose 0.9 percent in June after increasing 0.7 percent in May. Many of the same indexes continued to increase, including used cars and trucks, new vehicles, airline fares, and apparel. The index for medical care and the index for household furnishings and operations were among the few major component indexes which decreased in June.
The all items index rose 5.4 percent for the 12 months ending June; it has been trending up every month since January, when the 12-month change was 1.4 percent. The index for all items less food and energy rose 4.5 percent over the last 12-months, the largest 12-month increase since the period ending November 1991. The energy index rose 24.5 percent over the last 12-months, and the food index increased 2.4 percent.
emphasis added
Monday, July 12, 2021
Tuesday: CPI
by Calculated Risk on 7/12/2021 09:00:00 PM
From Matthew Graham at Mortgage News Daily: MBS RECAP: Still on a Fence as Bonds Work Through Early-Week Risks
We closed out last week on a fence about the short term outlook for rates. On the one hand, Friday was fairly weak. On the other hand that weakness followed 3 great days of gains and could furthermore be rationalized as defensive positioning ahead of early risks in the week ahead. We made it through half of those risks on Monday (3 and 10yr Treasury auction) with minimal damage, but certainly no major gains. As such, bonds look like they're keeping their options open for now. We hope to get a better lay of the land after tomorrow's events (CPI and 30yr bond auction). [30 year fixed 3.09%]Tuesday:
emphasis added
• At 6:00 AM ET, NFIB Small Business Optimism Index for June.
• At 8:30 AM, The Consumer Price Index for June from the BLS. The consensus is for a 0.5% increase in CPI, and a 0.4% increase in core CPI.
MBA Survey: "Share of Mortgage Loans in Forbearance Decreases to 3.76%"
by Calculated Risk on 7/12/2021 04:00:00 PM
Note: This is as of July 4th.
From the MBA: Share of Mortgage Loans in Forbearance Decreases to 3.76%
The Mortgage Bankers Association’s (MBA) latest Forbearance and Call Volume Survey revealed that the total number of loans now in forbearance decreased by 11 basis points from 3.87% of servicers’ portfolio volume in the prior week to 3.76% as of July 4, 2021. According to MBA’s estimate, 1.9 million homeowners are in forbearance plans.
The share of Fannie Mae and Freddie Mac loans in forbearance decreased 8 basis points to 1.91%. Ginnie Mae loans in forbearance decreased 32 basis points to 4.78%, while the forbearance share for portfolio loans and private-label securities (PLS) increased 2 basis points to 7.94%. The percentage of loans in forbearance for independent mortgage bank (IMB) servicers decreased 13 basis points to 3.87%, and the percentage of loans in forbearance for depository servicers also decreased 13 basis points to 3.98%.
“Forbearance exits increased in the week of the July 4th holiday to the fastest pace since early April,” said Mike Fratantoni, MBA’s Senior Vice President and Chief Economist. “New requests stayed very low, resulting in a large drop in the share of loans in forbearance, particularly for Ginnie Mae loans, which also continue to be impacted by buyouts of delinquent loans. These loans are tracked as portfolio loans after a buyout.”
Added Fratantoni, “The mortgage delinquency rate across the entire servicing portfolio declined in June compared to May. However, the delinquency rate slightly increased for homeowners who have completed a workout. Borrowers who are exiting forbearance now are likely to have been in relief for over a year, with almost 60 percent of borrowers in forbearance extensions of longer than 12 months. These borrowers may face more challenges getting back to making regular payments.”
emphasis added
 Click on graph for larger image.
This graph shows the percent of portfolio in forbearance by investor type over time. Most of the increase was in late March and early April 2020, and has trended down since then.
The MBA notes: "Total weekly forbearance requests as a percent of servicing portfolio volume (#) remained the same relative to the prior week at 0.04%.".
Note: Deferral plans are very popular. Basically when the homeowner exits forbearance, they just go back to making their regular monthly payments, they are not charged interest on the missed payments, and the unpaid balanced is deferred until the end of the mortgage.
July 12th COVID-19 New Cases, Vaccinations, Hospitalizations
by Calculated Risk on 7/12/2021 03:34:00 PM
According to the CDC, on Vaccinations.
Total doses administered: 334,600,770, as of a week ago 330,604,253. Average doses last week: 0.50 million per day.
| COVID Metrics | ||||
|---|---|---|---|---|
| Today | Yesterday | Week Ago | Goal | |
| Percent over 18, One Dose | 67.7% | 67.6% | 67.1% | ≥70.0%1,2 |
| Fully Vaccinated (millions) | 159.5 | 159.3 | 157.3 | ≥1601 |
| New Cases per Day3🚩 | 15,497 | 16,706 | 14,479 | ≤5,0002 |
| Hospitalized3🚩 | 12,831 | 13,273 | 11,904 | ≤3,0002 |
| Deaths per Day3 | 156 | 162 | 174 | ≤502 |
| 1 America's Short Term Goals, 2my goals to stop daily posts, 37 day average for Cases, Hospitalized, and Deaths 🚩 Increasing week-over-week for Cases, Hospitalized, and Deaths | ||||
KUDOS to the residents of the 20 states and D.C. that have already achieved the 70% goal: Vermont, Hawaii, Massachusetts and Connecticut are at 80%+, and Maine, New Mexico, New Jersey, Rhode Island, Pennsylvania, California, Maryland, Washington, New Hampshire, New York, Illinois, Virginia, Delaware, Minnesota, Oregon, Colorado and D.C. are all over 70%.
Next up are Wisconsin at 66.0%, Florida at 65.8%, Nebraska at 65.8%, Utah at 65.0%, South Dakota at 64.7%, and Iowa at 64.4%.
 Click on graph for larger image.
This graph shows the daily (columns) and 7 day average (line) of positive tests reported.
This data is from the CDC.
South Carolina Real Estate in June: Sales Up 15% YoY, Inventory Down 49% YoY
by Calculated Risk on 7/12/2021 03:12:00 PM
I'm tracking data for many local markets around the U.S. I think it is especially important to watch inventory this year.
From the South Carolina Realtors for the entire state:
Closed sales in June 2021 were 11,096, up 14.7% from 9,676 in June 2020.
Active Listings in June 2021 were 11,578, down 48.9% from 22,676 in June 2020.
Inventory in June was up 2.7% from the previous month.
Months of Supply was 1.2 Months in June 2021, compared to 2.8 Months in June 2020.
Boston Real Estate in June: Sales Up 77% YoY, Inventory Down 19% YoY
by Calculated Risk on 7/12/2021 01:04:00 PM
Note: I'm tracking data for many local markets around the U.S. I think it is especially important to watch inventory this year.
For Boston (single family and condos):


