 RSS Feed
 by Calculated Risk on 6/03/2021 06:16:00 PM
Thursday, June 03, 2021
Denver Real Estate in May: Sales Up 49% YoY, Active Inventory Down 71%
Sales slumped in April and May 2020, so the year-over-year (YoY) increase is large. That will likely reverse in June and sales will be down YoY.
From the DMAR: Monthly Indicators, May 2021
Total Residential Units Sold in May 2021 were 5,322, up 48.7% from 3,578 in May 2020.
Active Residential Listings in May 2021 were 2,075, down from 2,594 last month, and down 71.1% from 7,170 in May 2020.
Inventory in Denver had been fairly steady over the last 6 or 7 years, but declined sharply in 2020. This is the lowest level of inventory for May on record.
Interesting - In May, half the homes listed were sold (under contract) within four days!
Goldman May Payrolls Preview
by Calculated Risk on 6/03/2021 04:25:00 PM
A few brief excerpts from a note by Goldman Sachs economist Spencer Hill:
We estimate nonfarm payrolls rose 750k in May (mom sa) ... Following the surprisingly weak April report, we believe the further easing of business restrictions more than offset a moderate drag from labor supply factors and seasonality. ... We estimate a three-tenths drop in the unemployment rate to 5.8% (consensus 5.9%), reflecting a strong household employment gain but a further rise in the participation rate.CR Note: The consensus is for 650 thousand jobs added, and for the unemployment rate to decrease to 5.9%.
emphasis added
June 3rd COVID-19 New Cases, Vaccinations, Hospitalizations
by Calculated Risk on 6/03/2021 03:58:00 PM
This data is from the CDC.
According to the CDC, on Vaccinations.
Total doses administered: 297,720,928, as of yesterday 296,912,892. Per Day: 0.81 million.
| COVID Metrics | |||
|---|---|---|---|
| Current | Yesterday | Goal | |
| Percent over 18, One Dose | 63.0% | 62.9% | ≥70.0%1,2 |
| Fully Vaccinated (millions) | 136.6 | 136.2 | ≥1601 |
| New Cases per Day3 | 14,349 | 15,643 | ≤5,0002 |
| Hospitalized3 | 19,289 | 19,674 | ≤3,0002 |
| Deaths per Day3 | 324 | 328 | ≤502 |
| 1 America's Goal by July 4th, 2my goals to stop daily posts, 37 day average for Cases, Hospitalized, and Deaths | |||
KUDOS to the residents of the twelve states that have already achieved the 70% goal: Vermont and Hawaii are over 80%, plus Massachusetts, Connecticut, Maine, New Jersey, Rhode Island, New Mexico, Pennsylvania, New Hampshire, Maryland and California are all over 70%.
Next up are Washington at 69.7%, D.C. at 68.5%, New York at 68.2%, Illinois at 67.8%, Minnesota at 67.6%, Virginia at 67.5%, Delaware at 66.8%, Colorado at 66.5% and Oregon at 66.2%.
May Employment Preview
by Calculated Risk on 6/03/2021 12:22:00 PM
On Friday at 8:30 AM ET, the BLS will release the employment report for May. The consensus is for 650 thousand jobs added, and for the unemployment rate to decrease to 5.9%.
Some analysts are being cautious this month after the disappointing April report.
 • First, currently there are still about 8.2 million fewer jobs than in February 2020 (before the pandemic).
This graph shows the job losses from the start of the employment recession, in percentage terms.
The current employment recession was by far the worst recession since WWII in percentage terms, but is now better than the worst of the "Great Recession".
• ADP Report: The ADP employment report showed a gain of 978,000 private sector jobs, well above the consensus estimate of 650,000 jobs added. The ADP report hasn't been very useful in predicting the BLS report, but this suggests the BLS report could be above expectations.
• ISM Surveys: Note that the ISM services are diffusion indexes based on the number of firms hiring (not the number of hires). The ISM® manufacturing employment index decreased in May to 50.9%, down from 55.1% last month. This would suggest approximately 15,000 manufacturing jobs lost in May. ADP showed 52,000 manufacturing jobs added.
The ISM® Services employment index decreased in May to 55.3%, from 58.8% last month. This would suggest over 200,000 service jobs added in April. ADP showed 850,000 service jobs added.
• Unemployment Claims: The weekly claims report showed a sharp decline in the number of initial unemployment claims during the reference week (include the 12th of the month) from 566,000 in April to 444,000 in May. This would usually suggest a pickup in hiring, although this might not be very useful right now. In general, weekly claims have been lower than expectations.
 • Permanent Job Losers: Something to watch in the employment report will be "Permanent job losers". While there has been a strong bounce back in total employment, from the shutdown in March and April 2020, permanent job losers had been flat over the last several months.
This graph shows permanent job losers as a percent of the pre-recession peak in employment through the April report.
This data is only available back to 1994, so there is only data for three recessions. In April, the number of permanent job losers increased slightly to 3.529 million from 3.432 million in March.
• Conclusion: The ISM surveys suggest a weaker than expected jobs report, but the ADP report and unemployment claims suggest a stronger than expected report.
As far as the pandemic, the number of daily cases during the reference week in May was around 35,000, down sharply from around 67,000 in April. And vaccinations continue to increase. These are strong positives for the job market.
So my guess is the report will be above the consensus.
May Vehicles Sales decreased to 16.99 Million SAAR
by Calculated Risk on 6/03/2021 10:11:00 AM
The BEA released their estimate of light vehicle sales for May this morning. The BEA estimates sales of 16.99 million SAAR in May 2021 (Seasonally Adjusted Annual Rate), down 9.5% from the April sales rate, and up 40% from May 2020.
This was below the consensus estimate of 18.0 million SAAR.
 Click on graph for larger image.
This graph shows light vehicle sales since 2006 from the BEA (blue) and the BEA's estimate for May (red).
The impact of COVID-19 was significant, and April 2020 was the worst month.
Since April 2020, sales have increased, and are now close to sales in 2019 (the year before the pandemic).
Sales-to-date are up 1.5% compared to the same period in 2019.
The second graph shows light vehicle sales since the BEA started keeping data in 1967.
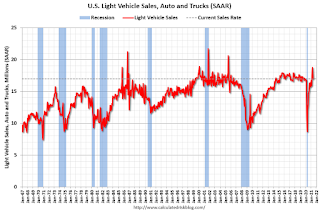 Note: dashed line is current estimated sales rate of 16.99 million SAAR.
The second graph shows light vehicle sales since the BEA started keeping data in 1967.
 Note: dashed line is current estimated sales rate of 16.99 million SAAR.
Sales in May were likely impacted by supply issues.
ISM® Services Index Increased to Record High 64.0% in May
by Calculated Risk on 6/03/2021 09:51:00 AM
(Posted with permission). The May ISM® Services index was at 64.0%, up from 62.7% last month. The employment index decreased to 55.3%, from 58.8%. Note: Above 50 indicates expansion, below 50 contraction.
From the Institute for Supply Management: May 2021 Services ISM® Report On Business®
Economic activity in the services sector grew in May for the 12th month in a row, say the nation’s purchasing and supply executives in the latest Services ISM® Report On Business®.The employment index decreased to 55.3% from 58.8% in April.
The report was issued today by Anthony Nieves, CPSM, C.P.M., A.P.P., CFPM, Chair of the Institute for Supply Management® (ISM®) Services Business Survey Committee: “The Services PMI® reached another all-time high in May, registering 64 percent, which is 1.3 percentage points higher than April’s reading of 62.7 percent. The previous record high was 63.7 percent in March. The May reading indicates the 12th straight month of growth for the services sector, which has expanded for all but two of the last 136 months.
“The Supplier Deliveries Index registered 70.4 percent, up 4.3 percentage points from April’s reading of 66.1 percent. (Supplier Deliveries is the only ISM® Report On Business® index that is inversed; a reading of above 50 percent indicates slower deliveries, which is typical as the economy improves and customer demand increases.) The Prices Index registered 80.6 percent, which is 3.8 percentage points higher than the April reading of 76.8 percent, indicating that prices increased in May, and at a faster rate. The last time the Prices Index was this elevated was when it registered 77.4 percent in July 2008; the all-time high is 83.5 percent in September 2005.
“According to the Services PMI®, all 18 services industries reported growth. The composite index indicated growth for the 12th consecutive month after a two-month contraction in April and May 2020. There was continued growth in the services sector in May. The rate of expansion is very strong, as businesses have reopened and production capacity has increased. However, some capacity constraints, material shortages, weather-related delays, and challenges in logistics and employment resources continue,” says Nieves.
emphasis added
Weekly Initial Unemployment Claims decrease to 385,000
by Calculated Risk on 6/03/2021 08:35:00 AM
The DOL reported:
In the week ending May 29, the advance figure for seasonally adjusted initial claims was 385,000, a decrease of 20,000 from the previous week's revised level. This is the lowest level for initial claims since March 14, 2020 when it was 256,000. The previous week's level was revised down by 1,000 from 406,000 to 405,000. The 4-week moving average was 428,000, a decrease of 30,500 from the previous week's revised average. This is the lowest level for this average since March 14, 2020 when it was 225,500. The previous week's average was revised down by 250 from 458,750 to 458,500.This does not include the 76,098 initial claims for Pandemic Unemployment Assistance (PUA) that was down from 93,559 the previous week.
emphasis added
The following graph shows the 4-week moving average of weekly claims since 1971.
 Click on graph for larger image.
The dashed line on the graph is the current 4-week average. The four-week average of weekly unemployment claims decreased to 458,750.
The previous week was revised down.
Regular state continued claims increased to 3,771,000 (SA) from 3,602,000 (SA) the previous week.
Note: There are an additional 6,368,301 receiving Pandemic Unemployment Assistance (PUA) that decreased from 6,515,657 the previous week (there are questions about these numbers). This is a special program for business owners, self-employed, independent contractors or gig workers not receiving other unemployment insurance. And an additional 5,293,842 receiving Pandemic Emergency Unemployment Compensation (PEUC) up from 5,191,642.
Weekly claims were lower than the consensus forecast.
ADP: Private Employment increased 978,000 in May
by Calculated Risk on 6/03/2021 08:20:00 AM
Private sector employment increased by 978,000 jobs from April to May according to the May ADP® National Employment ReportTM. Broadly distributed to the public each month, free of charge, the ADP National Employment Report is produced by the ADP Research Institute® in collaboration with Moody’s Analytics. The report, which is derived from ADP’s actual payroll data, measures the change in total nonfarm private employment each month on a seasonally-adjusted basis.This was well above the consensus forecast of 650,000 for this report.
“Private payrolls showed a marked improvement from recent months and the strongest gain since the early days of the recovery,” said Nela Richardson, chief economist, ADP. “While goods producers grew at a steady pace, it is service providers that accounted for the lion’s share of the gains, far outpacing the monthly average in the last six months. Companies of all sizes experienced an uptick in job growth, reflecting the improving nature of the panemic and economy.”
emphasis added
The BLS report will be released Friday, and the consensus is for 650 thousand non-farm payroll jobs added in May. The ADP report has not been very useful in predicting the BLS report.
Wednesday, June 02, 2021
Thursday: ADP Employment, Unemployment Claims, ISM Services
by Calculated Risk on 6/02/2021 08:11:00 PM
Thursday:
• At 8:15 AM ET, The ADP Employment Report for May. This report is for private payrolls only (no government). The consensus is for 650,000 payroll jobs added in May, down from 742,000 in April.
• At 8:30 AM, The initial weekly unemployment claims report will be released. The consensus is for a decrease to 395 thousand from 406 thousand last week.
• At 10:00 AM, the ISM Services Index for May. The consensus is for a reading of 63.0, up from 62.7.
June 2nd COVID-19 New Cases, Vaccinations, Hospitalizations
by Calculated Risk on 6/02/2021 04:04:00 PM
Note: Holidays distort the data for a few days.
According to the CDC, on Vaccinations.
Total doses administered: 296,912,892, as of yesterday 296,404,240. Per Day: 0.51 million.
| COVID Metrics | |||
|---|---|---|---|
| Current | Yesterday | Goal | |
| Percent over 18, One Dose | 62.9% | 62.8% | ≥70.0%1,2 |
| Fully Vaccinated (millions) | 136.2 | 135.9 | ≥1601 |
| New Cases per Day3 | 15,622 | 17,600 | ≤5,0002 |
| Hospitalized3 | 19,674 | 19,355 | ≤3,0002 |
| Deaths per Day3 | 363 | 380 | ≤502 |
| 1 America's Goal by July 4th, 2my goals to stop daily posts, 37 day average for Cases, Hospitalized, and Deaths | |||
KUDOS to the residents of the twelve states that have already achieved the 70% goal: Vermont and Hawaii are over 80%, plus Massachusetts, Connecticut, Maine, New Jersey, Rhode Island, New Mexico, Pennsylvania, New Hampshire, Maryland and California are all over 70%.
Next up are Washington at 69.5%, D.C. at 68.4%, New York at 68.1%, Illinois at 67.7%, Minnesota at 67.5%, Virginia at 67.5%, Delaware at 66.7%, Colorado at 66.3% and Oregon at 66.1%.


