 RSS Feed
 by Calculated Risk on 2/28/2021 09:30:00 PM
Sunday, February 28, 2021
Monday: ISM Manufacturing, Construction Spending
Weekend:
• Schedule for Week of February 28, 2021
Monday:
• At 10:00 AM ET, ISM Manufacturing Index for January. The consensus is for the ISM to be at 58.9, up from 58.7 in January.
• Also at 10:00 AM, Construction Spending for December. The consensus is for a 0.7% increase in construction spending.
From CNBC: Pre-Market Data and Bloomberg futures S&P 500 futures are up 28 and DOW futures are up 208 (fair value).
Oil prices were up over the last week with WTI futures at $62.22 per barrel and Brent at $65.11 barrel. A year ago, WTI was at $45, and Brent was at $51 - so WTI oil prices are UP about 45% year-over-year.
Here is a graph from Gasbuddy.com for nationwide gasoline prices. Nationally prices are at $2.73 per gallon. A year ago prices were at $2.43 per gallon, so gasoline prices are up $0.30 per gallon year-over-year.
February 28 COVID-19 Test Results and Vaccinations
by Calculated Risk on 2/28/2021 07:16:00 PM
SPECIAL NOTE: The Covid Tracking Project will end daily updates on March 7th.
From Bloomberg on vaccinations as of Feb 28th.
"In the U.S., more Americans have now received at least one dose than have tested positive for the virus since the pandemic began. So far, 75.2 million doses have been given. In the last week, an average of 1.74 million doses per day were administered."Here is the CDC COVID Data Tracker. This site has data on vaccinations, cases and more.
The US is averaged 1.5 million tests per day over the last week. The percent positive over the last 7 days was 4.5%.
Based on the experience of other countries, for adequate test-and-trace (and isolation) to reduce infections, the percent positive needs to below 1%, so the US has far too many daily cases - and percent positive - to do effective test-and-trace.
There were 1,346,785 test results reported over the last 24 hours.
There were 54,288 positive tests.
Over 71,000 US deaths have been reported in February. This was the third worst month of the pandemic (2nd worst month on a per day basis). See the graph on US Daily Deaths here.
This data is from the COVID Tracking Project.
And check out COVID Act Now to see how each state is doing. (updated link to new site)
 Click on graph for larger image.
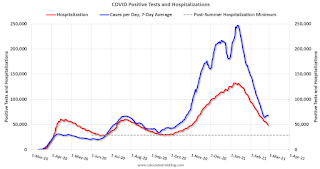
This graph shows the 7 day average of positive tests reported and daily hospitalizations.
There were 1,346,785 test results reported over the last 24 hours.
There were 54,288 positive tests.
Over 71,000 US deaths have been reported in February. This was the third worst month of the pandemic (2nd worst month on a per day basis). See the graph on US Daily Deaths here.
This data is from the COVID Tracking Project.
And check out COVID Act Now to see how each state is doing. (updated link to new site)
 Click on graph for larger image.
This graph shows the 7 day average of positive tests reported and daily hospitalizations.
The dashed line is the post-summer surge low for hospitalizations.
Update: A few comments on the Seasonal Pattern for House Prices
by Calculated Risk on 2/28/2021 11:22:00 AM
CR Note: This is a repeat of earlier posts with updated graphs.
A few key points:
1) There is a clear seasonal pattern for house prices.
2) The surge in distressed sales during the housing bust distorted the seasonal pattern.
3) Even though distressed sales are down significantly, the seasonal factor is based on several years of data - and the factor is now overstating the seasonal change (second graph below).
4) Still the seasonal index is probably a better indicator of actual price movements than the Not Seasonally Adjusted (NSA) index.
For in depth description of these issues, see Jed Kolko's article from 2014 (currently Chief Economist at Indeed) "Let’s Improve, Not Ignore, Seasonal Adjustment of Housing Data"
Note: I was one of several people to question the change in the seasonal factor (here is a post in 2009) - and this led to S&P Case-Shiller questioning the seasonal factor too (from April 2010). I still use the seasonal factor (I think it is better than using the NSA data).
 Click on graph for larger image.
This graph shows the month-to-month change in the NSA Case-Shiller National index since 1987 (through December 2020). The seasonal pattern was smaller back in the '90s and early '00s, and increased once the bubble burst.
The seasonal swings have declined since the bubble, although the recent price surge changed the month-over-year pattern.
 The second graph shows the seasonal factors for the Case-Shiller National index since 1987. The factors started to change near the peak of the bubble, and really increased during the bust.
The swings in the seasonal factors have started to decrease, and it seemed - as recent history is included in the factors - the seasonal factors had been moving back towards more normal levels.
The recent price surge might distort this a little.
Saturday, February 27, 2021
February 27 COVID-19 Test Results and Vaccinations
by Calculated Risk on 2/27/2021 07:42:00 PM
SPECIAL NOTE: The Covid Tracking Project will end daily updates on March 7th.
From Bloomberg on vaccinations as of Feb 27th.
"In the U.S., more Americans have now received at least one dose than have tested positive for the virus since the pandemic began. So far, 72.8 million doses have been given. In the last week, an average of 1.65 million doses per day were administered."Here is the CDC COVID Data Tracker. This site has data on vaccinations, cases and more.
The US is averaged 1.5 million tests per day over the last week. The percent positive over the last 7 days was 4.6%.
Based on the experience of other countries, for adequate test-and-trace (and isolation) to reduce infections, the percent positive needs to below 1%, so the US has far too many daily cases - and percent positive - to do effective test-and-trace.
There were 1,637,459 test results reported over the last 24 hours.
There were 70,622 positive tests.
Almost 70,000 US deaths have been reported in February. See the graph on US Daily Deaths here.
This data is from the COVID Tracking Project.
And check out COVID Act Now to see how each state is doing. (updated link to new site)
 Click on graph for larger image.
This graph shows the 7 day average of positive tests reported and daily hospitalizations.
The dashed line is the post-summer surge low for hospitalizations.
Real Personal Income less Transfer Payments
by Calculated Risk on 2/27/2021 11:45:00 AM
Government transfer payments increased sharply in January compared to December, and were $2.5 trillion (on SAAR basis) above the February 2020 level. Most of the increase in transfer payments - compared to the level prior to the crisis - is from unemployment insurance and "other" (includes direct payments).
This table shows the amount of unemployment insurance and "Other" transfer payments since February 2020 (pre-crisis level). The increase in "Other" was mostly due to other parts of the relief acts (including direct payments).
| Selected Transfer Payments Billions of dollars, SAAR | ||
|---|---|---|
| Other | Unemployment Insurance | |
| Feb-20 | $506 | $28 |
| Mar-20 | $515 | $74 |
| Apr-20 | $3,379 | $493 |
| May-20 | $1,360 | $1,356 |
| Jun-20 | $758 | $1,405 |
| Jul-20 | $760 | $1,331 |
| Aug-20 | $692 | $636 |
| Sep-20 | $936 | $359 |
| Oct-20 | $731 | $305 |
| Nov-20 | $619 | $281 |
| Dec-20 | $655 | $308 |
| Jan-21 | $2,337 | $571 |
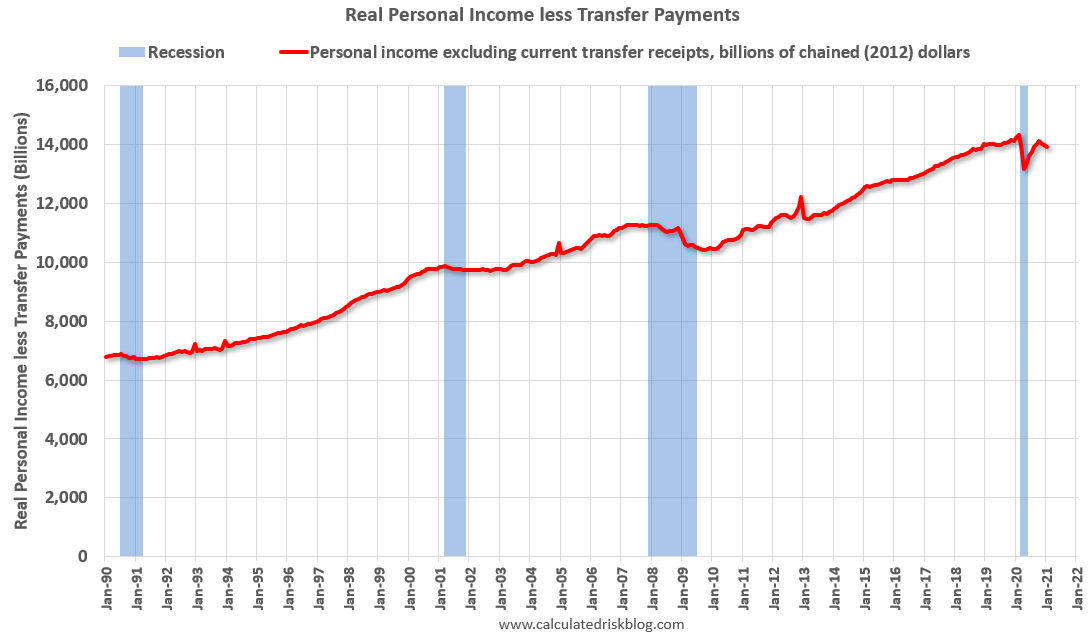
A key measure of the health of the economy (Used by NBER in recession dating) is Real Personal Income less Transfer payments.
 Click on graph for larger image.
This graph shows real personal income less transfer payments since 1990.
This measure of economic activity decreased 0.5% in January, compared to December, and was down 2.8% compared to February 2020 (previous peak).
 Another way to look at this data is as a percent of the previous peak.
Real personal income less transfer payments was off 8.1% in April. This was a larger decline than the worst of the great recession.
Currently personal income less transfer payments are still off 2.8% (dashed line).
Schedule for Week of February 28, 2021
by Calculated Risk on 2/27/2021 08:11:00 AM
The key report scheduled for this week is the February employment report.
Other key reports scheduled for this week are the trade deficit and February vehicle sales.
Fed Chair Powell speaks on the U.S. economy on Thursday.
10:00 AM: ISM Manufacturing Index for January. The consensus is for the ISM to be at 58.9, up from 58.7 in January.
10:00 AM: Construction Spending for December. The consensus is for a 0.7% increase in construction spending.
 All day: Light vehicle sales for February. The consensus is for light vehicle sales to be 16.4 million SAAR in February, down from 16.6 million in January (Seasonally Adjusted Annual Rate).
This graph shows light vehicle sales since the BEA started keeping data in 1967. The dashed line is the January sales rate.
10:00 AM: Corelogic House Price index for January.
7:00 AM ET: The Mortgage Bankers Association (MBA) will release the results for the mortgage purchase applications index.
8:15 AM: The ADP Employment Report for February. This report is for private payrolls only (no government). The consensus is for 168,000 payroll jobs added in February, down from 174,000 added in January.
10:00 AM: the ISM Services Index for February.
2:00 PM: the Federal Reserve Beige Book, an informal review by the Federal Reserve Banks of current economic conditions in their Districts.
8:30 AM: The initial weekly unemployment claims report will be released. The consensus is for a increase to 760 thousand from 730 thousand last week.
12:05 PM: Discussion with Fed Chair Jerome Powell, Conversation on the U.S. Economy, At The Wall Street Journal Jobs Summit (via livestream)
 8:30 AM: Employment Report for February. The consensus is for 148,000 jobs added, and for the unemployment rate to increase to 6.4%.
There were 49,000 jobs added in January, and the unemployment rate was at 6.3%.
This graph shows the job losses from the start of the employment recession, in percentage terms.
The current employment recession was by far the worst recession since WWII in percentage terms, and the worst in terms of the unemployment rate.
 8:30 AM: Trade Balance report for January from the Census Bureau.
 This graph shows the U.S. trade deficit, with and without petroleum, through the most recent report. The blue line is the total deficit, and the black line is the petroleum deficit, and the red line is the trade deficit ex-petroleum products.
The consensus is the trade deficit to be $67.5 billion. The U.S. trade deficit was at $66.6 billion in December.
Friday, February 26, 2021
February 26 COVID-19 Test Results and Vaccinations
by Calculated Risk on 2/26/2021 07:56:00 PM
SPECIAL NOTE: The Covid Tracking Project will end daily updates on March 7th.
From Bloomberg on vaccinations as of Feb 26th.
"In the U.S., more Americans have now received at least one dose than have tested positive for the virus since the pandemic began. So far, 70.5 million doses have been given. In the last week, an average of 1.45 million doses per day were administered."Here is the CDC COVID Data Tracker. This site has data on vaccinations, cases and more.
The US is averaged 1.45 million tests per day over the last week. The percent positive over the last 7 days was 4.7%.
Based on the experience of other countries, for adequate test-and-trace (and isolation) to reduce infections, the percent positive needs to below 1%, so the US has far too many daily cases - and percent positive - to do effective test-and-trace.
There were 1,793,570 test results reported over the last 24 hours.
There were 74,429 positive tests.
Over 68,000 US deaths have been reported in February. See the graph on US Daily Deaths here.
This data is from the COVID Tracking Project.
And check out COVID Act Now to see how each state is doing. (updated link to new site)
 Click on graph for larger image.
This graph shows the 7 day average of positive tests reported and daily hospitalizations.
The dashed line is the post-summer surge low for hospitalizations.
Fannie Mae: Mortgage Serious Delinquency Rate Decreased in January
by Calculated Risk on 2/26/2021 04:33:00 PM
Fannie Mae reported that the Single-Family Serious Delinquency decreased to 2.80% in January, from 2.87% in December. The serious delinquency rate is up from 0.66% in January 2020.
These are mortgage loans that are "three monthly payments or more past due or in foreclosure".
The Fannie Mae serious delinquency rate peaked in February 2010 at 5.59% following the housing bubble, and peaked at 3.32% in August 2020 during the pandemic.
 Click on graph for larger image
By vintage, for loans made in 2004 or earlier (2% of portfolio), 5.87% are seriously delinquent (down from 5.88% in December). For loans made in 2005 through 2008 (2% of portfolio), 9.98% are seriously delinquent (unchanged from 9.98%), For recent loans, originated in 2009 through 2018 (96% of portfolio), 2.32% are seriously delinquent (down from 2.39%). So Fannie is still working through a few poor performing loans from the bubble years.
Mortgages in forbearance are counted as delinquent in this monthly report, but they will not be reported to the credit bureaus.
This is very different from the increase in delinquencies following the housing bubble. Lending standards have been fairly solid over the last decade, and most of these homeowners have equity in their homes - and they will be able to restructure their loans once they are employed.
Note: Freddie Mac reported earlier.
NY Times Upshot: "Where Have All the Houses Gone?"
by Calculated Risk on 2/26/2021 12:51:00 PM
This is an excellent article by Emily Badger and Quoctrung Bui in the NY Times: Where Have All the Houses Gone? The authors discuss many of the issues we've discussed on why housing inventory is so low (pandemic, people renting homes, baby boomers aging in place, etc).
A brief excerpt on the conversion of single family homes to rental properties:
“Right now it’s a screaming good deal to have two properties: When my mortgage rate is 2.7 percent, why not have two of them?” said Michael Simonsen, the C.E.O. of Altos Research. “It took a long time, I think, to realize that that’s what was going on.”In 2015, housing economist Tom Lawler estimated there were 17.5 million renter occupied single family homes in the U.S., up from 10.7 million in 2000. Many of these houses were purchased by investors. Most of these rental conversions were at the lower end, and that limited the supply for first time buyers.
Over the past decade, he points out, the number of single-family homes in the rental market grew by more than seven million. And the vast majority of those are owned by individuals, not big institutional investors. Other opportunities to make revenue off investment properties have also boomed with the rise of companies like Airbnb.
Q1 GDP Forecasts
by Calculated Risk on 2/26/2021 11:20:00 AM
From Merrrill Lynch:
Our 1Q GDP tracking estimate held at 5.5% [Feb 26 estimate]From Goldman Sachs:
emphasis added
We left our Q1 GDP tracking estimate unchanged at +6.0% (qoq ar). [Feb 25 estimate]From the NY Fed Nowcasting Report
he New York Fed Staff Nowcast stands at 8.7% for 2021:Q1. [Feb 26 estimate]And from the Altanta Fed: GDPNow
The GDPNow model estimate for real GDP growth (seasonally adjusted annual rate) in the first quarter of 2021 is 8.8 percent on February 26, down from 9.6 percent on February 25. [Feb 26 estimate]


