 RSS Feed
 by Calculated Risk on 2/25/2021 04:48:00 PM
Thursday, February 25, 2021
Freddie Mac: Mortgage Serious Delinquency Rate decreased in January
Freddie Mac reported that the Single-Family serious delinquency rate in January was 2.56%, down from 2.64% in December. Freddie's rate is up from 0.60% in January 2020.
Freddie's serious delinquency rate peaked in February 2010 at 4.20% following the housing bubble, and peaked at 3.17% in August 2020 during the pandemic.
These are mortgage loans that are "three monthly payments or more past due or in foreclosure".
 Click on graph for larger image
Mortgages in forbearance are being counted as delinquent in this monthly report, but they will not be reported to the credit bureaus.
This is very different from the increase in delinquencies following the housing bubble. Lending standards have been fairly solid over the last decade, and most of these homeowners have equity in their homes - and they will be able to restructure their loans once (if) they are employed.
Also - for multifamily - delinquencies were at 0.16%, unchanged from 0.16% in December, and up double from 0.08% in January 2020.
Kansas City Fed: Tenth District Manufacturing Activity Increased in February
by Calculated Risk on 2/25/2021 02:02:00 PM
From the Kansas City Fed: Tenth District Manufacturing Activity Climbed Higher
The Federal Reserve Bank of Kansas City released the February Manufacturing Survey today. According to Chad Wilkerson, vice president and economist at the Federal Reserve Bank of Kansas City, the survey revealed that Tenth District manufacturing activity climbed higher in February compared to a month ago and a year ago, and expectations for future activity increased.This was the last of the regional Fed surveys for February.
“Regional factories reported higher activity in February,” said Wilkerson. “Most businesses reported more production and shipments, despite some difficulties due to the extreme weather events recently. However, rising materials prices and shipping delays have negatively affected 85% of firms.”
...
The month-over-month composite index was 24 in February, up from 17 in January and 14 in December. The composite index is an average of the production, new orders, employment, supplier delivery time, and raw materials inventory indexes. Manufacturing activity growth was driven by durable goods plants, specifically by primary and fabricated metals, machinery, and transportation equipment. Month-overmonth indexes for production and employment increased at a faster pace in February and supplier delivery time rose significantly. Shipments and new orders growth was positive in February, but slower than in recent months.
emphasis added
Here is a graph comparing the regional Fed surveys and the ISM manufacturing index:
 Click on graph for larger image.
The New York and Philly Fed surveys are averaged together (yellow, through February), and five Fed surveys are averaged (blue, through February) including New York, Philly, Richmond, Dallas and Kansas City. The Institute for Supply Management (ISM) PMI (red) is through January (right axis).
Based on these regional surveys, it seems likely the ISM manufacturing index will be solid again in February.
Hotels: Occupancy Rate Declined 23.8% Year-over-year
by Calculated Risk on 2/25/2021 11:16:00 AM
U.S. weekly hotel occupancy reached its highest level since late October, according to STR‘s latest data through Feb. 20.The following graph shows the seasonal pattern for the hotel occupancy rate using the four week average.
Feb. 14-20, 2021 (percentage change from comparable week in 2020):
• Occupancy: 48.1% (-23.8%)
• Average daily rate (ADR): US$101.57 (-22.1%)
• Revenue per available room (RevPAR): US$48.82 (-40.6%)
Popular leisure markets in Florida, with leftover demand from the long holiday weekend, posted the week’s highest levels. ... Additionally, displaced Texans pushed week-over-week occupancy gains across STR-defined markets in the state. Texas’ occupancy added almost a point to overall U.S. occupancy for the week.
emphasis added
 Click on graph for larger image.
The red line is for 2021, black is 2020, blue is the median, and dashed light blue is for 2009 (the worst year since the Great Depression for hotels prior to 2020).
Even when occupancy increases to 2009 levels, hotels will still be hurting.
In a few weeks, the year-over-year comparisons will be easy - since occupancy declined sharply at the onset of the pandemic - but occupancy will still be down significantly from normal levels.
Note: Y-axis doesn't start at zero to better show the seasonal change.
In a few weeks, the year-over-year comparisons will be easy - since occupancy declined sharply at the onset of the pandemic - but occupancy will still be down significantly from normal levels.
Note: Y-axis doesn't start at zero to better show the seasonal change.
NAR: Pending Home Sales Decrease 2.8% in January
by Calculated Risk on 2/25/2021 10:04:00 AM
From the NAR: Pending Home Sales Retreat 2.8% in January, but Climb From Last Year
Pending home sales took a step backward in January as inventory constraints continue to hold back prospective buyers, according to the National Association of Realtors®. The South was the lone region with a modest gain from the month prior, while the other three major U.S. regions experienced month-over-month decreases in January. However, all four areas saw contract transactions increase from a year-over-year standpoint, including two regions reaching double-digit gains, spurring an all-time high for pending home sales in the month of January.This was well below expectations for this index. Note: Contract signings usually lead sales by about 45 to 60 days, so this would usually be for closed sales in February and March.
The Pending Home Sales Index (PHSI), a forward-looking indicator of home sales based on contract signings, dropped 2.8% to 122.8 in January. Year-over-year, contract signings rose 13.0%. An index of 100 is equal to the level of contract activity in 2001.
...
The Northeast PHSI fell 7.4% to 101.6 in January, a 9.6% rise from a year ago. In the Midwest, the index declined 0.9% to 113.2 last month, up 8.6% from January 2020.
Pending home sales transactions in the South inched up 0.1% to an index of 151.3 in January, up 17.1% from January 2020. The index in the West dropped 7.8% in January, to 104.6, up 11.5% from a year prior.
emphasis added
Q4 GDP Growth Revised up slightly to 4.1% Annual Rate
by Calculated Risk on 2/25/2021 08:43:00 AM
From the BEA: Gross Domestic Product, Fourth Quarter and Year 2020 (Second Estimate)
Real gross domestic product (GDP) increased at an annual rate of 4.1 percent in the fourth quarter of 2020, according to the "second" estimate released by the Bureau of Economic Analysis. In the third quarter, real GDP increased 33.4 percent.Here is a Comparison of Second and Advance Estimates. PCE growth was revised down to 2.4% from 2.5%. Residential investment was revised up from 33.5% to 35.8%. This was at the consensus forecast.
The GDP estimate released today is based on more complete source data than were available for the "advance" estimate issued last month. In the advance estimate, the increase in real GDP was 4.0 percent. With the second estimate, upward revisions to residential fixed investment, private inventory investment, and state and local government spending were partly offset by a downward revision to personal consumption expenditures (PCE)
emphasis added
Weekly Initial Unemployment Claims decreased to 730,000
by Calculated Risk on 2/25/2021 08:38:00 AM
The DOL reported:
In the week ending February 20, the advance figure for seasonally adjusted initial claims was 730,000, a decrease of 111,000 from the previous week's revised level. The previous week's level was revised down by 20,000 from 861,000 to 841,000. The 4-week moving average was 807,750, a decrease of 20,500 from the previous week's revised average. The previous week's average was revised down by 5,000 from 833,250 to 828,250.This does not include the 451,402 initial claims for Pandemic Unemployment Assistance (PUA) that was down from 512,862 the previous week.
emphasis added
The following graph shows the 4-week moving average of weekly claims since 1971.
 Click on graph for larger image.
The dashed line on the graph is the current 4-week average. The four-week average of weekly unemployment claims decreased to 807,750.
The previous week was revised down.
The second graph shows seasonally adjust continued claims since 1967 (lags initial by one week).
 At the worst of the Great Recession, continued claims peaked at 6.635 million, but then steadily declined.
Regular state continued claims decreased to 4,419,000 (SA) from 4,520,000 (SA) the previous week and will likely stay at a high level until the crisis abates.
Note: There are an additional 7,518,951 receiving Pandemic Unemployment Assistance (PUA) that decreased from 7,685,857 the previous week (there are questions about these numbers). This is a special program for business owners, self-employed, independent contractors or gig workers not receiving other unemployment insurance. And an additional 5,065,890 receiving Pandemic Emergency Unemployment Compensation (PEUC) up from 4,062,189.
Weekly claims were much lower than the consensus forecast, and the previous week was revised down.
Wednesday, February 24, 2021
Thursday: GDP, Unemployment Claims, Pending Home Sales
by Calculated Risk on 2/24/2021 09:27:00 PM
Thursday:
• At 8:30 AM ET, The initial weekly unemployment claims report will be released. The consensus is for a decrease to 845 thousand from 861 thousand last week.
• Also at 8:30 AM, Gross Domestic Product, 4th quarter 2020 (Second estimate). The consensus is that real GDP increased 4.1% annualized in Q4, up from the advance estimate of 4.0%.
• Also at 8:30 AM, Durable Goods Orders for January from the Census Bureau. The consensus is for a 1.1% decrease in durable goods orders.
• At 10:00 AM, Pending Home Sales Index for January. The consensus is for a 0.1% decrease in the index.
• At 11:00 AM, the Kansas City Fed manufacturing survey for February. This is the last of regional manufacturing surveys for February.
February 24 COVID-19 Test Results and Vaccinations
by Calculated Risk on 2/24/2021 07:03:00 PM
SPECIAL NOTE: The Covid Tracking Project will end daily updates on March 7th.
From Bloomberg on vaccinations as of Feb 24th.
"In the U.S., more Americans have now received at least one dose than have tested positive for the virus since the pandemic began. So far, 65 million doses have been given. In the last week, an average of 1.28 million doses per day were administered."Here is the CDC COVID Data Tracker. This site has data on vaccinations, cases and more.
The US is averaged 1.4 million tests per day over the last week. The percent positive over the last 7 days was 4.8%.
Based on the experience of other countries, for adequate test-and-trace (and isolation) to reduce infections, the percent positive needs to below 1%, so the US has far too many daily cases - and percent positive - to do effective test-and-trace.
There were 1,464,714 test results reported over the last 24 hours.
There were 73,258 positive tests.
Almost 63,000 US deaths have been reported in February. See the graph on US Daily Deaths here.
This data is from the COVID Tracking Project.
And check out COVID Act Now to see how each state is doing. (updated link to new site)
 Click on graph for larger image.
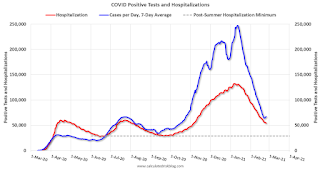
This graph shows the 7 day average of positive tests reported and daily hospitalizations.
There were 1,464,714 test results reported over the last 24 hours.
There were 73,258 positive tests.
Almost 63,000 US deaths have been reported in February. See the graph on US Daily Deaths here.
This data is from the COVID Tracking Project.
And check out COVID Act Now to see how each state is doing. (updated link to new site)
 Click on graph for larger image.
This graph shows the 7 day average of positive tests reported and daily hospitalizations.
The dashed line is the post-summer surge low for hospitalizations.
AIA: "Architecture Billings continue to contract" in January
by Calculated Risk on 2/24/2021 02:09:00 PM
Note: This index is a leading indicator primarily for new Commercial Real Estate (CRE) investment.
From the AIA: Architectural billings continue to contract in 2021
A slight improvement in business conditions has led to fewer architecture firms reporting declining billings, according to a new report today from The American Institute of Architects (AIA).
AIA’s Architecture Billings Index (ABI) score for January was 44.9 compared to 42.3 in December (any score below 50 indicates a decline in firm billings). Last month’s score indicates overall revenue at U.S architecture firms continued to decline from December to January, however, the pace of decline slowed. Inquiries into new projects during January grew for the second month in a row, with a score of 56.8 compared to 51.7 in December. The value of new design contracts also reflected an easing in the pace of decline, rising to a score of 48.8 in January from 47.0 the previous month.
“The broader economy entered a soft spot during the fourth quarter of last year, and business conditions at design firms have reflected this general slowdown,” said AIA Chief Economist, Kermit Baker, Hon. AIA, PhD. “While federal stimulus and the increasing pace of vaccinations may begin to accelerate progress in the coming months, the year has gotten off to a slow start, with architecture firms in all regions of the country and in all specializations reporting continued declines in project billings.”
...
• Regional averages: South (47.4); West (42.8); Midwest (42.2); Northeast (41.9)
• Sector index breakdown: mixed practice (47.9); multi-family residential (44.4); commercial/industrial (44.3); institutional (39.9)
emphasis added
 Click on graph for larger image.
This graph shows the Architecture Billings Index since 1996. The index was at 44.9 in January, up from 42.3 in December. Anything below 50 indicates contraction in demand for architects' services.
Note: This includes commercial and industrial facilities like hotels and office buildings, multi-family residential, as well as schools, hospitals and other institutions.
This index has been below 50 for eleven consecutive months. This represents a significant decrease in design services, and suggests a decline in CRE investment through most of 2021 (This usually leads CRE investment by 9 to 12 months).
This weakness is not surprising since certain segments of CRE are struggling, especially offices and retail.
Black Knight: National Mortgage Delinquency Rate Decreased in January
by Calculated Risk on 2/24/2021 12:51:00 PM
Note: Loans in forbearance are counted as delinquent in this survey, but those loans are not reported as delinquent to the credit bureaus.
From Black Knight: Black Knight’s First Look: Mortgage Delinquency Rate Falls Below 6% for First Time in Nearly a Year, Yet 2.1M Homeowners Remain Seriously Delinquent
• The national mortgage delinquency rate fell to 5.9% in January, dropping below 6% for the first time since March 2020According to Black Knight's First Look report, the percent of loans delinquent decreased 3.8% in January compared to December, and increased 82% year-over-year.
• January’s improvement among overall delinquencies as well as seriously past due mortgages was nearly identical to the average monthly improvement seen during the recovery to date
• While delinquencies continue to improve slowly and steadily, some 2.1 million homeowners remain 90 or more days past due but not yet in foreclosure – still five times pre-pandemic levels
• Recent forbearance and foreclosure moratorium extensions have reduced near-term risk, but at the same time may have the effect of extending the length of the recovery period
• At the current rate of improvement, 1.8 million mortgages will still be seriously delinquent at the end of June when foreclosure moratoriums on government-backed loans are currently slated to lift
• With widespread moratoriums still in place, both foreclosure starts and sales (completions) remained near record lows in January
• Prepayment activity fell by 17% month-over-month in January but remains 86% above last year’s levels
emphasis added
The percent of loans in the foreclosure process decreased 3.9% in December and were down 31% over the last year.
Black Knight reported the U.S. mortgage delinquency rate (loans 30 or more days past due, but not in foreclosure) was 5.85% in January, down from 6.08% in December.
The percent of loans in the foreclosure process decreased in January to 0.32%, from 0.33% in December.
The number of delinquent properties, but not in foreclosure, is up 1,425,000 properties year-over-year, and the number of properties in the foreclosure process is down 75,000 properties year-over-year.
| Black Knight: Percent Loans Delinquent and in Foreclosure Process | ||||
|---|---|---|---|---|
| Jan 2021 | Dec 2020 | Jan 2020 | Jan 2019 | |
| Delinquent | 5.85% | 6.08% | 3.22% | 3.75% |
| In Foreclosure | 0.32% | 0.33% | 0.46% | 0.51% |
| Number of properties: | ||||
| Number of properties that are delinquent, but not in foreclosure: | 3,130,000 | 3,251,000 | 1,705,000 | 1,945,000 |
| Number of properties in foreclosure pre-sale inventory: | 171,000 | 178,000 | 246,000 | 265,000 |
| Total Properties | 3,301,000 | 3,429,000 | 1,951,000 | 2,210,000 |


