by Calculated Risk on 2/21/2021 09:11:00 PM
Sunday, February 21, 2021
Sunday Night Futures
Weekend:
• Schedule for Week of February 21, 2021
Monday:
• At 8:30 AM ET, Chicago Fed National Activity Index for January. This is a composite index of other data.
• At 10:30 AM, Dallas Fed Survey of Manufacturing Activity for February.
From CNBC: Pre-Market Data and Bloomberg futures S&P 500 and DOW futures are mostly unchanged (fair value).
Oil prices were up over the last week with WTI futures at $59.24 per barrel and Brent at $62.91 barrel. A year ago, WTI was at $53, and Brent was at $59 - so WTI oil prices are UP about 10% year-over-year.
Here is a graph from Gasbuddy.com for nationwide gasoline prices. Nationally prices are at $2.64 per gallon. A year ago prices were at $2.47 per gallon, so gasoline prices are up $0.17 per gallon year-over-year.
February 21 COVID-19 Test Results and Vaccinations
by Calculated Risk on 2/21/2021 07:00:00 PM
SPECIAL NOTE: The Covid Tracking Project will end daily updates on March 7th.
From Bloomberg on vaccinations as of Feb 21st.
"In the U.S., more Americans have now received at least one dose than have tested positive for the virus since the pandemic began. So far, 63.1 million doses have been given. In the last week, an average of 1.33 million doses per day were administered."Here is the CDC COVID Data Tracker. This site has data on vaccinations, cases and more.
The US is averaged 1.3 million tests per day over the last week. The percent positive over the last 7 days was 4.9%.
There were 1,225,773 test results reported over the last 24 hours.
There were 58,429 positive tests.
Almost 57,000 US deaths have been reported in February. See the graph on US Daily Deaths here.
This data is from the COVID Tracking Project.
And check out COVID Act Now to see how each state is doing. (updated link to new site)
 Click on graph for larger image.
This graph shows the 7 day average of positive tests reported and daily hospitalizations.
Graham: "Time to Wake Up To The New Mortgage Rate Reality"
by Calculated Risk on 2/21/2021 10:18:00 AM
A few excerpts from an article by Matthew Graham at MortgageNewsDaily: Time to Wake Up To The New Mortgage Rate Reality
There's no precedent for the winning streak enjoyed by mortgage rates in the 2nd half of 2020. We've never seen so many new record lows in the same year, and we never spent as much time at those lows (not even close). All of the above makes it easy to get lulled into a false sense of low-rate security, but it's time to wake up.
...
Following the Georgia senate election, we've been tracking a surge in bond market volatility based on the expectation that it would increasingly spill over to the mortgage rate world.
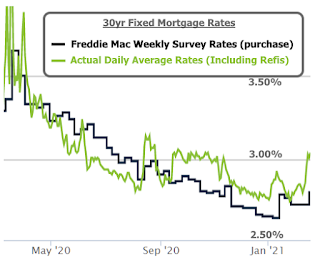
As of this week, that spillover arrived in grand fashion with many lenders quoting rates that are as much as three eighths of a point higher than they were last week. That means if you were looking at something in the 2.75% neighborhood on Friday, it could be 3.125% today....
 Click on graph for larger image.
"But wait... I heard that mortgage rates are still really low and that they only went up a tiny amount this week!"CR Note: Rates are still historically very low, however we will likely see a slowdown in refinance activity. Purchase activity will likely remain strong (rising rates sometimes pushes people to buy since they don't want to miss out). The best case scenario for the economy (pandemic ending, etc), could lead to a slowdown for housing for two reasons: higher mortgage rates, and more inventory (from record lows).
Well, that depends on your perspective. Is 3.125% still really low for the average 30yr fixed mortgage rate? Yes! That was the all-time low before covid. But is it much higher relative to the past few weeks and months? Here too, it depends on your perspective, so let's leave it at this: rates rose more this week than on any other week in the past 11 months.
If you've heard that rates only rose slightly, it may have to do with headlines quoting Freddie Mac's weekly survey. While that survey is accurate over time, it doesn't capture short-term volatility. It also tends to stop measuring most of any given week's volatility on Monday, and Monday was a holiday! As such, it's lagging the reality on the street.
Saturday, February 20, 2021
February 20 COVID-19 Test Results and Vaccinations; Hospitalizations Below Summer Peak
by Calculated Risk on 2/20/2021 06:52:00 PM
SPECIAL NOTE: The Covid Tracking Project will end daily updates on March 7th.
From Bloomberg on vaccinations as of Feb 19th.
"In the U.S., more Americans have now received at least one dose than have tested positive for the virus since the pandemic began. So far, 60.5 million doses have been given, according to a state-by-state tally. In the last week, an average of 1.49 million doses per day were administered."Here is the CDC COVID Data Tracker. This site has data on vaccinations, cases and more.
The US is averaged 1.35 million tests per day over the last week. The percent positive over the last 7 days was 4.9%.
There were 1,274,526 test results reported over the last 24 hours.
There were 71,951 positive tests.
Almost 56,000 US deaths have been reported in February. See the graph on US Daily Deaths here.
This data is from the COVID Tracking Project.
And check out COVID Act Now to see how each state is doing. (updated link to new site)
 Click on graph for larger image.
This graph shows the 7 day average of positive tests reported and daily hospitalizations.
Schedule for Week of February 21, 2021
by Calculated Risk on 2/20/2021 08:11:00 AM
The key reports this week are January New Home sales and the second estimate of Q4 GDP.
Other key reports include Case-Shiller house prices and Personal Income and Outlays for January.
For manufacturing, the February Dallas, Richmond and Kansas City manufacturing surveys will be released.
8:30 AM ET: Chicago Fed National Activity Index for January. This is a composite index of other data.
10:30 AM: Dallas Fed Survey of Manufacturing Activity for February.
9:00 AM: FHFA House Price Index for December 2020. This was originally a GSE only repeat sales, however there is also an expanded index.
 9:00 AM: S&P/Case-Shiller House Price Index for December.
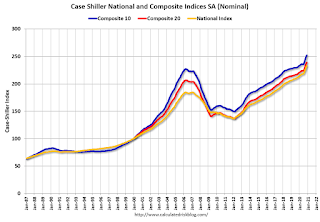
This graph shows the year-over-year change for the Case-Shiller National, Composite 10 and Composite 20 indexes, through the most recent report (the Composite 20 was started in January 2000).
The consensus is for a 9.1% year-over-year increase in the Comp 20 index for December.
10:00 AM: Richmond Fed Survey of Manufacturing Activity for February.
10:00 AM: Testimony, Fed Chair Jerome Powell, Semiannual Monetary Policy Report to the Congress, Before the Committee on Banking, Housing, and Urban Affairs, U.S. Senate
7:00 AM ET: The Mortgage Bankers Association (MBA) will release the results for the mortgage purchase applications index.
 10:00 AM: New Home Sales for January from the Census Bureau.
 This graph shows New Home Sales since 1963.
The dashed line is the sales rate for last month.
The consensus is for 855 thousand SAAR, up from 842 thousand in December.
10:00 AM: Testimony, Fed Chair Jerome Powell, Semiannual Monetary Policy Report to the Congress, Before the Committee on Financial Services, U.S. House of Representatives
During the day: The AIA's Architecture Billings Index for January (a leading indicator for commercial real estate).
8:30 AM: The initial weekly unemployment claims report will be released. The consensus is for a decrease to 845 thousand from 861 thousand last week.
8:30 AM: Gross Domestic Product, 4th quarter 2020 (Second estimate). The consensus is that real GDP increased 4.1% annualized in Q4, up from the advance estimate of 4.0%.
8:30 AM: Durable Goods Orders for January from the Census Bureau. The consensus is for a 1.1% decrease in durable goods orders.
10:00 AM: Pending Home Sales Index for January. The consensus is for a 0.1% decrease in the index.
11:00 AM: the Kansas City Fed manufacturing survey for February. This is the last of regional manufacturing surveys for February.
8:30 AM ET: Personal Income and Outlays for January. The consensus is for a 10.0% increase in personal income, and for a 2.5% increase in personal spending. And for the Core PCE price index to increase 0.1%.
9:45 AM: Chicago Purchasing Managers Index for February. The consensus is for a reading of 61.0, down from 63.8 in January.
10:00 AM: University of Michigan's Consumer sentiment index (Final for February). The consensus is for a reading of 76.2.
Friday, February 19, 2021
February 19 COVID-19 Test Results and Vaccinations; Hospitalizations Decline to Summer Peak
by Calculated Risk on 2/19/2021 07:12:00 PM
SPECIAL NOTE: The Covid Tracking Project will end daily updates on March 7th.
From Bloomberg on vaccinations as of Feb 18th.
"In the U.S., more Americans have now received at least one dose than have tested positive for the virus since the pandemic began. So far, 59.1 million doses have been given, according to a state-by-state tally. In the last week, an average of 1.58 million doses per day were administered."Here is the CDC COVID Data Tracker. This site has data on vaccinations, cases and more.
The US is averaged 1.4 million tests per day over the last week. The percent positive over the last 7 days was 4.8%.
There were 1,878,276 test results reported over the last 24 hours.
There were 74,676 positive tests.
Almost 54,000 US deaths have been reported in February. See the graph on US Daily Deaths here.
This data is from the COVID Tracking Project.
And check out COVID Act Now to see how each state is doing. (updated link to new site)
 Click on graph for larger image.
This graph shows the 7 day average of positive tests reported and daily hospitalizations.
CAR on California January Housing: Sales up 23% YoY, Active Listings down 53% YoY
by Calculated Risk on 2/19/2021 02:08:00 PM
The CAR reported: California housing market momentum continues into new year, C.A.R. reports
California’s housing market kicked off the year on a positive note, following up on December’s strong showing with double-digit price and sales growth on a yearly basis in January, the CALIFORNIA ASSOCIATION OF REALTORS® (C.A.R.) said today.CR Note: Existing home sales are reported when the transaction closes, so this was mostly for contracts signed in November and December.
Closed escrow sales of existing, single-family detached homes in California totaled a seasonally adjusted annualized rate of 484,730 in January, according to information collected by C.A.R. from more than 90 local REALTOR® associations and MLSs statewide. The statewide annualized sales figure represents what would be the total number of homes sold during 2021 if sales maintained the January pace throughout the year. It is adjusted to account for seasonal factors that typically influence home sales.
January home sales decreased 4.9 percent from 509,750 in December and were up 22.5 percent from a year ago, when 395,700 homes were sold on an annualized basis. The year-over-year, double-digit sales gain was the sixth consecutive and the third straight month that sales increased more than 20 percent from a year ago.
...
“Despite an economy that’s slow to recover, the momentum from late last year continued into January, driven by strong growth in California’s core housing markets, especially in the San Francisco Bay Area, where the higher cost areas experienced the most sales growth,” said C.A.R. President Dave Walsh, vice president and manager of the Compass San Jose office. “Home prices continued to power through the traditional slow season in January with the largest annual price gain in nearly seven years.”
...
Homeowners reluctant to list their homes for sale during the pandemic is contributing to a shortage of active listings. As a result, C.A.R.’s Unsold Inventory Index (UII) remains extremely low at 1.5 months in January and was down sharply from 3.4 months in January 2020. The index indicates the number of months it would take to sell the supply of homes on the market at the current rate of sales.
Active listings fell 53.4 percent from last year and continued to drop more than 40 percent on a year-over-year basis for the eighth straight month. On a month-to-month basis, for-sale properties dropped 10.7 percent in January.
emphasis added
Q1 GDP Forecasts: Movin' on up
by Calculated Risk on 2/19/2021 12:28:00 PM
From Merrrill Lynch:
Retail sales boosted our 1Q21 GDP tracking estimate by 1.5pp to 5.5% qoq saar. [Feb 19 estimate] emphasis addedFrom Goldman Sachs:
We boosted our Q1 GDP tracking estimate by 1pp to +6.0% (qoq ar). [Feb 17 estimate]From the NY Fed Nowcasting Report
The New York Fed Staff Nowcast stands at 8.3% for 2021:Q1. [Feb 19 estimate]And from the Altanta Fed: GDPNow
The GDPNow model estimate for real GDP growth (seasonally adjusted annual rate) in the first quarter of 2021 is 9.5 percent on February 18 [Feb 18 estimate]
Comments on January Existing Home Sales
by Calculated Risk on 2/19/2021 10:42:00 AM
Earlier: NAR: Existing-Home Sales Increased to 6.69 million in January
A few key points:
1) This was the highest sales rate for January since 2005, and the 2nd highest sales for January on record. Some of the increase over the last seven months was probably related to pent up demand from the shutdowns in March and April. Other reasons include record low mortgage rates, a move away from multi-family rentals, strong second home buying (to escape the high-density cities), a strong stock market and favorable demographics.
2) Inventory is very low, and was down 25.7% year-over-year (YoY) in January. Also, as housing economist Tom Lawler has noted, the local MLS data shows even a larger decline in active inventory (the NAR appears to include some pending sales in inventory). Lawler noted:
"As I’ve noted before, the inventory measure in most publicly-released local realtor/MLS reports excludes listings with pending contracts, but that is not the case for many of the reports sent to the NAR (referred to as the “NAR Report!”), Since the middle of last Spring inventory measures excluding pending listings have fallen much more sharply than inventory measures including such listings, and this latter inventory measure understates the decline in the effective inventory of homes for sale over the last several months."Months-of-supply is at a record low. Inventory will be important to watch in 2021, see: Some thoughts on Housing Inventory
 Click on graph for larger image.
This graph shows existing home sales by month for 2020 and 2021.
The year-over-year comparisons will be easy in the first half of 2021 - especially in April, May and June - and then difficult in the second half of the year.
Sales NSA in January (367,000) were 15.8% above sales last year in January (317,000). This was the highest sales for January (NSA) since 2006.
NAR: Existing-Home Sales Increased to 6.69 million in January
by Calculated Risk on 2/19/2021 10:18:00 AM
From the NAR: Existing-Home Sales Tick Up 0.6% in January
Total existing-home sales, completed transactions that include single-family homes, townhomes, condominiums and co-ops, increased 0.6% from December to a seasonally-adjusted annual rate of 6.69 million in January. Sales in total climbed year-over-year, up 23.7% from a year ago (5.41 million in January 2020).Note: December was revised down from 6.76 million to 6.65 million SAAR.
Total housing inventory at the end of January amounted to 1.04 million units, down 1.9% from December and down 25.7% from one year ago (1.40 million). Unsold inventory sits at a 1.9-month supply at the current sales pace, equal to December's supply and down from the 3.1-month amount recorded in January 2020. NAR first began tracking the single-family home supply in 1982.
emphasis added
 Click on graph for larger image.
This graph shows existing home sales, on a Seasonally Adjusted Annual Rate (SAAR) basis since 1993.
Sales in January (6.69 million SAAR) were up 0.6% from last month, and were 23.7% above the January 2020 sales rate.
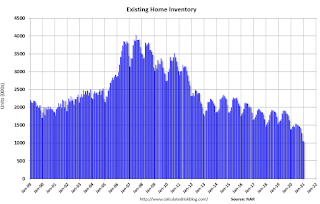
The second graph shows nationwide inventory for existing homes.
 According to the NAR, inventory decreased to 1.04 million in January from 1.06 million in December. Headline inventory is not seasonally adjusted, and inventory usually decreases to the seasonal lows in December and January, and peaks in mid-to-late summer.
The last graph shows the year-over-year (YoY) change in reported existing home inventory and months-of-supply. Since inventory is not seasonally adjusted, it really helps to look at the YoY change. Note: Months-of-supply is based on the seasonally adjusted sales and not seasonally adjusted inventory.
 Inventory was down 25.7% year-over-year in January compared to January 2020.
 Months of supply was unchanged at 1.9 months in January (tied for all time low).
This was above the consensus forecast. I'll have more later.


