 RSS Feed
 by Calculated Risk on 1/13/2021 07:00:00 AM
Wednesday, January 13, 2021
MBA: Mortgage Applications Increase in Latest Weekly Survey
From the MBA: Mortgage Applications Increase in Latest MBA Weekly Survey
Mortgage applications increased 16.7 percent from one week earlier, according to data from the Mortgage Bankers Association’s (MBA) Weekly Mortgage Applications Survey for the week ending January 8, 2021. The previous week’s results included an adjustment for the holidays.
... The Refinance Index increased 20 percent from the previous week and was 93 percent higher than the same week one year ago. The seasonally adjusted Purchase Index increased 8 percent from one week earlier. The unadjusted Purchase Index increased 60 percent compared with the previous week and was 10 percent higher than the same week one year ago.
“Booming refinance activity in the first full week of 2021 caused mortgage applications to surge to their highest level since March 2020, despite most mortgage rates in the survey rising last week. The expectation of additional fiscal stimulus from the incoming administration, and the rollout of vaccines improving the outlook, drove Treasury yields and rates higher. The 30-year fixed mortgage rate climbed two basis points to 2.88 percent, but reversing the trend, the 15-year fixed rate ticked down to 2.39 percent – a record low,” said Joel Kan, MBA’s Associate Vice President of Economic and Industry Forecasting. “Even with the rise in mortgage rates, refinancing did not slow to begin the year, with the index hitting its highest level since last March. Both conventional and government refinance applications increased, with applications for government loans having their strongest week since June 2012.”
Added Kan, “Sustained housing demand continued to support purchase growth, with activity up nearly 10 percent from a year ago. The lower average loan balance observed was partly due to a 9.2 percent increase in FHA applications, which is a positive sign of more lower-income and first-time buyers returning to the market.”
...
The average contract interest rate for 30-year fixed-rate mortgages with conforming loan balances ($510,400 or less) increased to 2.88 percent from 2.86 percent, with points decreasing to 0.33 from 0.35 (including the origination fee) for 80 percent loan-to-value ratio (LTV) loans.
emphasis added
 Click on graph for larger image.
The first graph shows the refinance index since 1990.
The refinance index has been very volatile recently depending on rates and liquidity.
But with record low rates, the index remains up significantly from last year.
 The second graph shows the MBA mortgage purchase index
According to the MBA, purchase activity is up 10% year-over-year unadjusted.
Note: Red is a four-week average (blue is weekly).
Tuesday, January 12, 2021
Wednesday: CPI, Beige Book
by Calculated Risk on 1/12/2021 09:26:00 PM
Wednesday:
• At 7:00 AM ET, The Mortgage Bankers Association (MBA) will release the results for the mortgage purchase applications index.
• At 8:30 AM, The Consumer Price Index for December from the BLS. The consensus is for 0.4% increase in CPI, and a 0.1% increase in core CPI.
• At 2:00 PM, the Federal Reserve Beige Book, an informal review by the Federal Reserve Banks of current economic conditions in their Districts.
January 12 COVID-19 Test Results; Record 7-Day Deaths
by Calculated Risk on 1/12/2021 07:32:00 PM
Note: It is possible the 7-day average cases is nearing a peak. I'm looking forward to not posting this data in a few months.
The US is now averaging close to 2 million tests per day. Based on the experience of other countries, for adequate test-and-trace (and isolation) to reduce infections, the percent positive needs to be under 5% (probably close to 1%), so the US has far too many daily cases - and percent positive - to do effective test-and-trace.
There were 1,871,244 test results reported over the last 24 hours.
There were 213,885 positive tests.
Almost 35,000 US deaths have been reported so far in January. See the graph on US Daily Deaths here.
 Click on graph for larger image.
This data is from the COVID Tracking Project.
The percent positive over the last 24 hours was 11.4% (red line is 7 day average). The percent positive is calculated by dividing positive results by total tests (including pending).
And check out COVID Act Now to see how each state is doing. (updated link to new site)
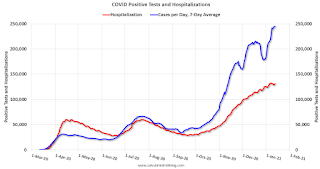 The second graph shows the 7 day average of positive tests reported and daily hospitalizations.
• Record 7-Day Deaths
Denver Real Estate in December: Sales Up 5% YoY, Active Inventory Down 50%
by Calculated Risk on 1/12/2021 01:29:00 PM
From the DMAR: Monthly Indicators, December 2020
The number of residential units sold in December (attached and detached) increased to 4,807, up 4.9% from 4,582 in December 2019.
Active listings were at 2,541, down 49.6% from 5,037 in December 2019. This is a record low.
Annual sales were up 7.0% compared to 2019.
BLS: Job Openings "Little Changed" at 6.5 Million in November
by Calculated Risk on 1/12/2021 10:06:00 AM
From the BLS: Job Openings and Labor Turnover Summary
The number of job openings was little changed at 6.5 million on the last business day of November, the U.S. Bureau of Labor Statistics reported today. Hires were little changed at 6.0 million while total separations increased to 5.4 million. Within separations, the quits rate was unchanged at 2.2 percent while the layoffs and discharges rate increased to 1.4 percent.The following graph shows job openings (yellow line), hires (dark blue), Layoff, Discharges and other (red column), and Quits (light blue column) from the JOLTS.
emphasis added
This series started in December 2000.
Note: The difference between JOLTS hires and separations is similar to the CES (payroll survey) net jobs headline numbers. This report is for November, the most recent employment report was for December.
 Click on graph for larger image.
Note that hires (dark blue) and total separations (red and light blue columns stacked) are usually pretty close each month. This is a measure of labor market turnover. When the blue line is above the two stacked columns, the economy is adding net jobs - when it is below the columns, the economy is losing jobs.
The huge spikes in layoffs and discharges in March and April 2020 are labeled, but off the chart to better show the usual data.
Jobs openings decreased in November to 6.527 million from 6.632 million in October.
The number of job openings (yellow) were down 3.9% year-over-year. Note that job openings were declining a year ago prior to the pandemic.
Quits were down 10.5% year-over-year. These are voluntary separations. (see light blue columns at bottom of graph for trend for "quits").
Small Business Optimism Decreased in December
by Calculated Risk on 1/12/2021 08:34:00 AM
Most of this survey is noise, but sometimes there is some information.
From the National Federation of Independent Business (NFIB): December 2020 Report
The Optimism Index declined to 95.9 in December, down 5.5. points from November. Nine of the 10 Index components declined and one improved. The NFIB Uncertainty Index decreased 8 points to 82. Owners expecting better business conditions over the next six months declined 24 points to a net negative 16 percent. The percent of owners thinking it’s a good time to expand decreased 4 points to 8 percent. Sales expectations over the next three months declined 14 points to a net negative 4 percent.
.
Covid-19 is spreading at record rates and hospitals are at capacity in many states. Several vaccines were proven effective in trials, approved for emergency use, and now being distributed. But business restrictions and consumer spending shifts are still firmly in place and will be until the spread of Covid-19 is largely curbed.
emphasis added
 Click on graph for larger image.
This graph shows the small business optimism index since 1986.
The index declined in December.
Monday, January 11, 2021
Tuesday: Job Openings
by Calculated Risk on 1/11/2021 09:23:00 PM
From Matthew Graham at Mortgage News Daily: Rates Rising at Fastest Pace in Months
Mortgage rates are coming off a rough week--the roughest, in fact, since June 2020 by some measures. That's the last time rates rose this quickly for market-driven reasons. There were a few instances of bigger moves in Aug/Sept as the new refinance fee was announced, delayed, and ultimately implemented. Either way, things aren't great right now, relatively speaking.Tuesday:
The "relative" qualification is important considering this abrupt move higher has yet to threaten to take the average top tier 30yr fixed quote above 3%--far from it, in fact. Most lenders can still offer 2.875% or better on refis and 2.625% or better on purchases. This assumes an ideal scenario with 20%+ equity, strong credit, etc.
emphasis added
• At 6:00 AM ET, NFIB Small Business Optimism Index for December.
• At 10:00 AM, Job Openings and Labor Turnover Survey for November from the BLS.
January 11 COVID-19 Test Results; Record 7-Day Cases and Deaths
by Calculated Risk on 1/11/2021 07:18:00 PM
Note: I'm looking forward to not posting this data in a few months.
The US is now averaging close to 2 million tests per day. Based on the experience of other countries, for adequate test-and-trace (and isolation) to reduce infections, the percent positive needs to be under 5% (probably close to 1%), so the US has far too many daily cases - and percent positive - to do effective test-and-trace.
There were 1,897,059 test results reported over the last 24 hours.
There were 193,857 positive tests.
Almost 31,000 US deaths have been reported so far in January. See the graph on US Daily Deaths here.
 Click on graph for larger image.
This data is from the COVID Tracking Project.
The percent positive over the last 24 hours was 10.2% (red line is 7 day average). The percent positive is calculated by dividing positive results by total tests (including pending).
And check out COVID Act Now to see how each state is doing. (updated link to new site)
 The second graph shows the 7 day average of positive tests reported and daily hospitalizations.
• Record 7-Day Cases
• Record 7-Day Deaths
MBA Survey: "Share of Mortgage Loans in Forbearance Decreases to 5.46%"
by Calculated Risk on 1/11/2021 04:00:00 PM
Note: This is as of January 3rd.
From the MBA: Share of Mortgage Loans in Forbearance Decreases to 5.46%
The Mortgage Bankers Association’s (MBA) latest Forbearance and Call Volume Survey revealed that the total number of loans now in forbearance decreased from 5.53% of servicers’ portfolio volume in the prior week to 5.46% as of January 3, 2021. According to MBA’s estimate, 2.7 million homeowners are in forbearance plans.
...
"The share of loans in forbearance slightly declined for each investor category entering the new year, remaining within the narrow range observed for the last two months,” said Mike Fratantoni, MBA’s Senior Vice President and Chief Economist. “The data show that those homeowners who remain in forbearance are more likely to be in distress, with fewer continuing to make any payments and fewer exiting forbearance each month. Those borrowers who do exit are also more likely to require a modification to their ongoing repayment plans.”
Fratantoni continued, “Surging COVID-19 cases caused economic activity to stall in December, with a monthly job loss for the first time since April, and with those jobs mostly concentrated in the leisure and hospitality sector. We expect that this slowdown will prevent any rapid improvement in the forbearance numbers over the next few months.”
emphasis added
 Click on graph for larger image.
This graph shows the percent of portfolio in forbearance by investor type over time. Most of the increase was in late March and early April, and has generally been trending down.
The MBA notes: "Total weekly forbearance requests as a percent of servicing portfolio volume (#) increased relative to the prior week from 0.06% to 0.07%."
Sacramento Housing in December: Sales increase 23% YoY, Active Inventory down 44% YoY
by Calculated Risk on 1/11/2021 03:06:00 PM
Note that December sales are for contracts typically signed in October and November.
From SacRealtor.org: December sales volume up 23% annually, inventory at .5 months
December ended with 1,528 sales, up 1.1% from the 1,511 sales in November. Compared to one year ago (1,244), the current figure is up 22.8%.
...
The Active Listing Inventory decreased 23.4% from November to December, from 959 units to 735 units.
Compared with December 2019 (1,315), inventory is down 44.1%. The Months of Inventory dropped from .6 Months to .5 Months. This figure represents the amount of time (in months) it would take for the current rate of sales to deplete the total active listing inventory. The chart below reflects the Months of Inventory in each price range.
...
The Median DOM (days on market) remained at 7 and the Average DOM remained at 16. “Days on market” represents the days between the initial listing of the home as “active” and the day it goes “pending.” Of the 1,528 sales this month, 87% (1,329) were on the market for 30 days or less and 95.8% (1,463) were on the market for 60 days or less.
emphasis added


