by Calculated Risk on 10/23/2020 11:30:00 AM
Friday, October 23, 2020
NMHC: "October Apartment Market Conditions Showed Some Rebound from COVID-19 Impacts"
The National Multifamily Housing Council (NMHC) released their October report: October Apartment Market Conditions Showed Some Rebound from COVID-19 Impacts
Apartment market conditions moderated in the National Multifamily Housing Council’s Quarterly Survey of Apartment Market Conditions for October 2020, as the industry continues to cope with the ongoing Covid-19 pandemic. While the Sales Volume (72), Equity Financing (62) and Debt Financing (73) indexes all came in above the breakeven level (50), the index for Market Tightness (35) indicated continued weakness.
“The ongoing Covid-19 pandemic continues to constrain economic activity, resulting in higher vacancies and lower rent growth for apartments overall,” noted NMHC Chief Economist Mark Obrinsky. “Still, industry professionals are observing more favorable conditions in many suburban markets. And, while this round marks the fourth consecutive quarter of deteriorating conditions, there was considerably more variation in responses compared to last quarter – less than half (49 percent) thought that market conditions were looser.”
...
The Market Tightness Index increased from 19 to 35, indicating looser market conditions. Nearly half (49 percent) of respondents reported looser market conditions than three months prior, compared to 18 percent who reported tighter conditions. One in three respondents (33 percent) felt that conditions were no different from last quarter.

Click on graph for larger image.
This graph shows the quarterly Apartment Tightness Index. Any reading below 50 indicates looser conditions from the previous quarter.
Black Knight: Number of Homeowners in COVID-19-Related Forbearance Plans Declined Slightly
by Calculated Risk on 10/23/2020 09:19:00 AM
Note: Both Black Knight and the MBA (Mortgage Bankers Association) are putting out weekly estimates of mortgages in forbearance.
This data is as of October 20th.
From Forbearance Volumes Continue Modest Improvement from Pandemic-Related Peak
The market saw modest improvement in forbearances this past week, according to data from Black Knight’s McDash Flash Forbearance Tracker.
Forbearance volumes fell by 11K from the prior week, which was the result of larger declines among GSE loans (14K) and portfolio-held and privately securitized loans (2K) being offset by an increase of 5K in FHA/VA loans in forbearance.
Click on graph for larger image.
As of Oct. 20, nearly 3 million borrowers remain in active COVID-19 forbearance plans, which represents 5.6% of first lien mortgages. This is a noticeable reduction from the market’s peak of 4.76 million in late May. More than 80% of remaining forbearance plans have had their terms extended with their servicer.
Despite the muted improvement seen this week, overall forbearance volumes are down 623K month-over-month, driven by the large reduction in loans in active forbearance plans at the beginning of the month. This marks a 17% decline from September, showing sustained downward movement in forbearance volumes.
emphasis added
Thursday, October 22, 2020
October 22 COVID-19 Test Results
by Calculated Risk on 10/22/2020 06:42:00 PM
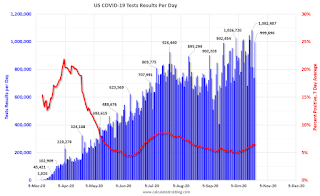
The US is now mostly reporting 700 thousand to 1 million tests per day. Based on the experience of other countries, the percent positive needs to be well under 5% to really push down new infections (probably close to 1%), so the US still needs to increase the number of tests per day significantly (or take actions to push down the number of new infections).
There were 999,696 test results reported over the last 24 hours.
There were 76,560 positive tests.
Over 15,900 Americans deaths from COVID have been reported in October. See the graph on US Daily Deaths here.

This data is from the COVID Tracking Project.
The percent positive over the last 24 hours was 7.7% (red line is 7 day average).
For the status of contact tracing by state, check out testandtrace.com.
And check out COVID Exit Strategy to see how each state is doing.

The dashed line is the July high.
Note that there were very few tests available in March and April, and many cases were missed (the percent positive was very high - see first graph). By June, the percent positive had dropped below 5%.
Everyone needs to be vigilant or we might see record high 7-day average cases before the end of October.
Black Knight: National Mortgage Delinquency Rate Decreased in September
by Calculated Risk on 10/22/2020 01:03:00 PM
Note: Loans in forbearance are counted as delinquent in this survey, but those loans are not reported as delinquent to the credit bureaus.
From Black Knight: Serious Delinquencies Improved in September for the First Time Since the Start of the Pandemic
• The number of seriously delinquent mortgages (90+ days) fell by 43,000 in September, marking the first such improvement in serious delinquencies since the start of the pandemicAccording to Black Knight's First Look report, the percent of loans delinquent decreased 3.1% in September compared to August, and increased 89% year-over-year.
• More than 2.3 million homeowners – five times the number entering 2020 – remain 90 or more days past due, but not in foreclosure
• The national delinquency rate fell in September to 6.66%, down from 6.88% the month prior
• Early-stage delinquencies continue to show strong improvement, with rolls from current to 30-days delinquent, as well as the number of borrowers less than 90 days delinquent, having returned to pre-pandemic levels
• Both foreclosure starts and foreclosure sales continue to remain muted given the widespread foreclosure moratoriums still in place
emphasis added
The percent of loans in the foreclosure process decreased 2.9% in September and were down 29% over the last year.
Black Knight reported the U.S. mortgage delinquency rate (loans 30 or more days past due, but not in foreclosure) was 6.66% in September, down from 6.88% in August.
The percent of loans in the foreclosure process decreased in September to 0.34%, from 0.35% in August.
The number of delinquent properties, but not in foreclosure, is up 1,688,000 properties year-over-year, and the number of properties in the foreclosure process is down 71,000 properties year-over-year.
| Black Knight: Percent Loans Delinquent and in Foreclosure Process | ||||
|---|---|---|---|---|
| Sept 2020 | Aug 2020 | Sept 2019 | Sept 2018 | |
| Delinquent | 6.66% | 6.88% | 3.53% | 3.97% |
| In Foreclosure | 0.34% | 0.35% | 0.48% | 0.52% |
| Number of properties: | ||||
| Number of properties that are delinquent, but not in foreclosure: | 3,542,000 | 3,679,000 | 1,854,000 | 2,049,000 |
| Number of properties in foreclosure pre-sale inventory: | 181,000 | 187,000 | 252,000 | 268,000 |
| Total Properties | 3,722,000 | 3,867,000 | 2,106,000 | 2,317,000 |
NMHC: Rent Payment Tracker Shows Households Paying Rent Declined in October
by Calculated Risk on 10/22/2020 11:50:00 AM
From the NMHC: NMHC Rent Payment Tracker Finds 90.6 Percent of Apartment Households Paid Rent as of October 20
The National Multifamily Housing Council (NMHC)’s Rent Payment Tracker found 90.6 percent of apartment households made a full or partial rent payment by October 20 in its survey of 11.4 million units of professionally managed apartment units across the country.
This is a 1.8-percentage point, or 199,224-household decrease from the share who paid rent through October 20, 2019 and compares to 90.1 percent that had paid by September 20, 2020. These data encompass a wide variety of market-rate rental properties across the United States, which can vary by size, type and average rental price.
“The importance of the initial support provided to apartment residents by the CARES Act is becoming increasingly clear,” said Doug Bibby, NMHC President. “However, that support has now long since expired and the savings households were able to build are evaporating quickly. NMHC continues to urge lawmakers to come together and pass meaningful assistance to support renters and keep America’s rental housing sector stable.”
emphasis added
This graph from the NMHC Rent Payment Tracker shows the percent of household making full or partial rent payments by the 20th of the month.
CR Note: This is mostly for large, professionally managed properties.
Comments on September Existing Home Sales
by Calculated Risk on 10/22/2020 11:24:00 AM
Earlier: NAR: Existing-Home Sales Increased to 6.54 million in September
A few key points:
1) This was the highest sales rate since 2006. Existing home sales are counted at the close of escrow, so the September report was mostly for contracts signed in July and August - when the economy was much more open than in March and April. Some of the increase over the last few months was probably related to pent up demand from the shutdowns in March and April. However, with the high unemployment rate and the high rate of COVID infections, housing might be under some pressure in 2021. That is difficult to predict and depends on the course of the pandemic.
2) Inventory is very low, and was down 19.2% year-over-year (YoY) in September. This is the lowest level of inventory for September since at least the early 1990s.
3) As usual, housing economist Tom Lawler's forecast was closer to the NAR report than the Consensus.

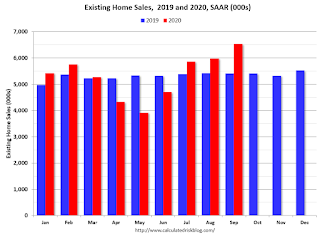
This graph shows existing home sales by month for 2019 and 2020.
Note that existing home sales picked up somewhat in the second half of 2019 as interest rates declined.
Even with weak sales in April, May, and June, sales to date are only down about 0.2% compared to the same period in 2019.

Sales NSA in September (560,000) were 24% above sales last year in September(450,000).
NAR: Existing-Home Sales Increased to 6.54 million in September
by Calculated Risk on 10/22/2020 10:11:00 AM
From the NAR: Existing-Home Sales Soar 9.4% to 6.5 Million in September
Total existing-home sales, completed transactions that include single-family homes, townhomes, condominiums and co-ops, rose 9.4% from August to a seasonally-adjusted annual rate of 6.54 million in September. Overall sales rose year-over-year, up 20.9% from a year ago (5.41 million in September 2019).
...
Total housing inventory at the end of September totaled 1.47 million units, down 1.3% from August and down 19.2% from one year ago (1.82 million). Unsold inventory sits at a 2.7-month supply at the current sales pace, down from 3.0 months in August and down from the 4.0-month figure recorded in September 2019.
emphasis added
 Click on graph for larger image.
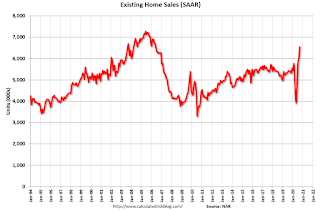
This graph shows existing home sales, on a Seasonally Adjusted Annual Rate (SAAR) basis since 1993.
Sales in September (6.54 million SAAR) were up 9.4% from last month, and were 20.9% above the September 2019 sales rate.
This was the highest sales rate since 2006.
The second graph shows nationwide inventory for existing homes.
 According to the NAR, inventory decreased to 1.47 million in September from 1.49 million in August. Headline inventory is not seasonally adjusted, and inventory usually decreases to the seasonal lows in December and January, and peaks in mid-to-late summer.
The last graph shows the year-over-year (YoY) change in reported existing home inventory and months-of-supply. Since inventory is not seasonally adjusted, it really helps to look at the YoY change. Note: Months-of-supply is based on the seasonally adjusted sales and not seasonally adjusted inventory.
 Inventory was down 19.2% year-over-year in September compared to September 2019.
 Months of supply decreased to 2.7 months in September.
This was above the consensus forecast. I'll have more later.
Weekly Initial Unemployment Claims decrease to 787,000
by Calculated Risk on 10/22/2020 08:39:00 AM
Special Note: "California has completed its pause in processing of initial claims and
has resumed reporting actual unemployment insurance claims data based on their weekly claims
activity. This News Release reflects actual counts for California for the current week and
revisions to the two prior weeks."
The DOL reported:
In the week ending October 17, the advance figure for seasonally adjusted initial claims was 787,000, a decrease of 55,000 from the previous week's revised level. The previous week's level was revised down by 56,000 from 898,000 to 842,000. The 4-week moving average was 811,250, a decrease of 21,500 from the previous week's revised average. The previous week's average was revised down by 33,500 from 866,250 to 832,750.This does not include the 345,440 initial claims for Pandemic Unemployment Assistance (PUA) that was up from 337,228 the previous week. (There are some questions on PUA numbers).
emphasis added
The following graph shows the 4-week moving average of weekly claims since 1971.
 Click on graph for larger image.
The dashed line on the graph is the current 4-week average. The four-week average of weekly unemployment claims decreased to 811,250.
The previous week was revised down.
The second graph shows seasonally adjust continued claims since 1967 (lags initial by one week).
 At the worst of the Great Recession, continued claims peaked at 6.635 million, but then steadily declined.
Continued claims decreased to 8,373,000 (SA) from 9,397,000 (SA) last week and will likely stay at a high level until the crisis abates.
Note: There are an additional 10,232,853 receiving Pandemic Unemployment Assistance (PUA) that decreased from 10,658,673 the previous week (there are questions about these numbers). This is a special program for business owners, self-employed, independent contractors or gig workers not receiving other unemployment insurance.
Wednesday, October 21, 2020
Thursday: Existing Home Sales, Unemployment Claims
by Calculated Risk on 10/21/2020 09:00:00 PM
Thursday:
• At 8:30 AM ET, The initial weekly unemployment claims report will be released. The consensus is initial claims decreased to 860 thousand from 898 thousand last week.
• At 10:00 AM, Existing Home Sales for September from the National Association of Realtors (NAR). The consensus is for 6.25 million SAAR, up from 6.00 million in August.
• At 11:00 AM, the Kansas City Fed manufacturing survey for October.
October 21 COVID-19 Test Results
by Calculated Risk on 10/21/2020 07:08:00 PM
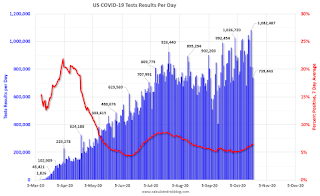
The US is now mostly reporting 700 thousand to 1 million tests per day. Based on the experience of other countries, the percent positive needs to be well under 5% to really push down new infections (probably close to 1%), so the US still needs to increase the number of tests per day significantly (or take actions to push down the number of new infections).
There were 739,443 test results reported over the last 24 hours.
There were 57,294 positive tests.
Over 14,700 Americans deaths from COVID have been reported in October. See the graph on US Daily Deaths here.

This data is from the COVID Tracking Project.
The percent positive over the last 24 hours was 7.7% (red line is 7 day average).
For the status of contact tracing by state, check out testandtrace.com.
And check out COVID Exit Strategy to see how each state is doing.

The dashed line is the July high.
Note that there were very few tests available in March and April, and many cases were missed (the percent positive was very high - see first graph). By June, the percent positive had dropped below 5%.
Everyone needs to be vigilant or we might see record high 7-day average cases before the end of October.


