by Calculated Risk on 10/07/2020 10:25:00 AM
Wednesday, October 07, 2020
Update: Framing Lumber Prices Up 65% Year-over-year
Here is another monthly update on framing lumber prices.
This graph shows CME framing futures through Oct 2nd.

There is a seasonal pattern for lumber prices, and usually prices will increase in the Spring, and peak around May, and then bottom around October or November - although there is quite a bit of seasonal variability.
Clearly there has been a surge in demand for lumber and the mills are struggling to meet demand.
MBA: Mortgage Applications Increase in Latest Weekly Survey
by Calculated Risk on 10/07/2020 07:00:00 AM
From the MBA: Mortgage Applications Increase in Latest MBA Weekly Survey
Mortgage applications increased 4.6 percent from one week earlier, according to data from the Mortgage Bankers Association’s (MBA) Weekly Mortgage Applications Survey for the week ending October 2, 2020.
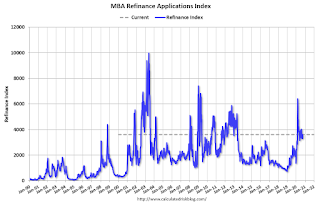
... The Refinance Index increased 8 percent from the previous week and was 50 percent higher than the same week one year ago. The seasonally adjusted Purchase Index decreased 2 percent from one week earlier. The unadjusted Purchase Index decreased 1 percent compared with the previous week and was 21 percent higher than the same week one year ago.
“Mortgage rates declined across the board last week – with most falling to record lows – and borrowers responded. The refinance index jumped 8 percent and hit its highest level since mid-August,” said Joel Kan, MBA’s Associate Vice President of Economic and Industry Forecasting. “Continuing the trend seen in recent months, the purchase market is growing at a strong clip, with activity last week up 21 percent from a year ago. The average loan size increased again to a new record at $371,500, as activity in the higher loan size categories continues to lead growth.”
Added Kan, “There are signs that demand is waning at the entry-level portion of the market because of supply and affordability hurdles, as well as the adverse economic impact the pandemic is having on hourly workers and low-and moderate-income households. As a result, the lower price tiers are seeing slower growth, which is contributing to the rising trend in average loan balances.”
...
The average contract interest rate for 30-year fixed-rate mortgages with conforming loan balances ($510,400 or less) decreased to 3.01 percent from 3.05 percent, with points decreasing to 0.37 from 0.52 (including the origination fee) for 80 percent loan-to-value ratio (LTV) loans.
emphasis added
 Click on graph for larger image.
The first graph shows the refinance index since 1990.
The refinance index has been very volatile recently depending on rates and liquidity.
But with record low rates, the index remains up significantly from last year.
 The second graph shows the MBA mortgage purchase index
According to the MBA, purchase activity is up 21% year-over-year unadjusted.
Note: Red is a four-week average (blue is weekly).
Tuesday, October 06, 2020
Wednesday: FOMC Minutes
by Calculated Risk on 10/06/2020 09:14:00 PM
Wednesday:
• At 7:00 AM ET, The Mortgage Bankers Association (MBA) will release the results for the mortgage purchase applications index.
• At 2:00 PM, FOMC Minutes, Meeting of September 15-16, 2020
October 6 COVID-19 Test Results
by Calculated Risk on 10/06/2020 06:49:00 PM
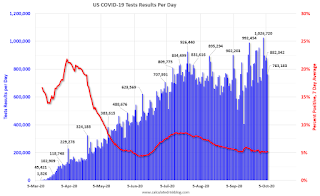
The US is now mostly reporting 700 thousand to 1 million tests per day. Based on the experience of other countries, the percent positive needs to be well under 5% to really push down new infections (probably close to 1%), so the US still needs to increase the number of tests per day significantly (or take actions to push down the number of new infections).
There were 763,183 test results reported over the last 24 hours.
There were 38,696 positive tests.
Over 3,700 Americans deaths from COVID have been reported in October. See the graph on US Daily Deaths here.

This data is from the COVID Tracking Project.
The percent positive over the last 24 hours was 5.1% (red line is 7 day average).
For the status of contact tracing by state, check out testandtrace.com.
And check out COVID Exit Strategy to see how each state is doing.

The dashed line is the June low.
Note that there were very few tests available in March and April, and many cases were missed (the percent positive was very high - see first graph). By June, the percent positive had dropped below 5%.
If people stay vigilant, the number of cases might drop to the June low in November (that would still be a large number of new cases, but progress).
Reis: Office, Mall and Apartment Vacancy Rates Increased in Q3
by Calculated Risk on 10/06/2020 02:39:00 PM
From Reis economist Barbara Byrne Denham:
The Apartment Vacancy Rate rose to 5.0% in the third quarter, the highest rate since the first quarter of 2012.
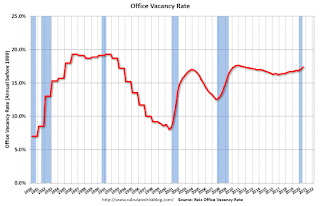
The Office Vacancy Rate rose 0.3% to 17.4%, the highest since Q3 2011 as occupancy declined by 5.85 million square feet; the Average Office Asking Rent increased 0.2%, but the Effective Rent declined 0.2% in the quarter.
The Retail Vacancy Rate increased 0.2% in the quarter to 10.4%, the highest since Q4 2013 as occupancy declined 2.63 million square feet; the Average Asking Rent declined 0.1% while the Average Effective Rent fell 0.4%.
The average Mall Vacancy Rate climbed 0.3% in the quarter to 10.1%, the highest in more than 20 years. The average Asking Rent decreased 0.7% in the quarter and 0.6% over the year.
…
Conclusion
The third quarter statistics clearly show that property owners started to feel the impact of the pandemic. Ironically, occupancy growth in the apartment market was net positive, yet rents fell dramatically, especially in some high-priced markets as tenants had the upper hand and property owners recognized this and lowered rents to maintain occupancy.
...
Finally, the office market may have seen the smallest impact thus far, but this was likely due to the term structure of leases – the average lease term is 9 years. Still, the continued work-from-home option driven by the pandemic has prompted many office planners to re-consider future office needs which will impact the office market for years.
Thus, our outlook remains cautious: vacancies will continue to rise and rents will decline further. However, rent declines will likely not accelerate until 2021 as layoffs from airlines and other industries that had been supported by the CARES Act will hit the economy; and more leases up for renewal are either not renewed, get downsized and/or are renewed at lower rents.
 Click on graph for larger image.
This graph shows the regional and strip mall vacancy rate starting in 1980 (prior to 2000 the data is annual).
For Neighborhood and Community malls (strip malls), the vacancy rate was 10.4% in Q3, up from 10.2% in Q2, and up from 10.1% in Q3 2019.
For strip malls, the vacancy rate peaked at 11.1% in Q3 2011, and the low was 9.8% in Q2 2016.
For Regional malls, the vacancy rate was 10.1% in Q3, up from 9.8% in Q2, and up from 9.4% in Q3 2019.
 This graph shows the office vacancy rate starting in 1980 (prior to 1999 the data is annual).
Reis reported the vacancy rate was at 17.4% in Q3, up from 17.1% in Q2, and up from 16.9% in Q3 2019. The office vacancy rate had been mostly moving sideways at an elevated level, but has increased over the last two years. And will likely increase further as leases expire.
 The third graph shows the apartment vacancy rate starting in 1980. (Annual rate before 1999, quarterly starting in 1999). Note: Reis is just for large cities.
Reis reported the vacancy rate was at 5.0% in Q3, up from 4.9% Q2, and up from 4.6% in Q3 2019.
The apartment vacancy rate will probably stay fairly low if there is additional disaster relief. However, the vacancy rate could increase sharply if the eviction moratoriums end and there is minimal additional disaster relief.
All vacancy data courtesy of Reis
Las Vegas Real Estate in September: Sales up 16% YoY, Inventory down 31% YoY
by Calculated Risk on 10/06/2020 01:02:00 PM
This report is for closed sales in September; sales are counted at the close of escrow, so the contracts for these homes were mostly signed in July and August.
The Las Vegas Realtors reported Southern Nevada home prices keep climbing amid housing shortage, LVR housing statistics for September 2020
LVR reported a total of 3,996 existing local homes, condos and townhomes were sold during September. Compared to the same time last year, September sales were up 18.9% for homes and up 6.8% for condos and townhomes.1) Overall sales were down 16.5% year-over-year to 3,996 in September 2020 from 3,430 in September 2019.
...
By the end of September, LVR reported 4,798 single-family homes listed for sale without any sort of offer. That’s down 34.6% from one year ago. For condos and townhomes, the 1,525 properties listed without offers in September represent a 16.7% drop from one year ago.
…
Despite the coronavirus crisis, the number of so-called distressed sales remains near historically low levels. The association reported that short sales and foreclosures combined accounted for just 1.0% of all existing local property sales in September. That compares to 2.0% of all sales one year ago, 2.5% two years ago and 5.2% three years ago.
emphasis added
2) Active inventory (single-family and condos) is down from a year ago, from a total of 9,164 in September 2019 to 6,323 in September 2020. Note: Total inventory was down 31.0% year-over-year. And months of inventory is low.
3) Low level of distressed sales.
CoreLogic: House Prices up 5.9% Year-over-year in August
by Calculated Risk on 10/06/2020 12:49:00 PM
Notes: This CoreLogic House Price Index report is for August. The recent Case-Shiller index release was for July. The CoreLogic HPI is a three month weighted average and is not seasonally adjusted (NSA).
From CoreLogic: Home Price Insights for August 2020
Home prices nationwide, including distressed sales, increased year over year by 5.9% in August 2020 compared with August 2019 and increased month over month by 1% in August 2020 compared with July 2020 (revisions with public records data are standard, and to ensure accuracy, CoreLogic incorporates the newly released public data to provide updated results).CR Note: The overall impact on house prices will depend on the duration of the crisis.
...
“The imbalance between homebuyer demand and for-sale inventory is particularly acute for lower-priced homes. Because of this imbalance, homes priced more than 25% below the median were up 8.6% in price over the last year, compared with the 5.9% price increase for all homes.” - Dr. Frank Nothaft, Chief Economist for CoreLogic
Despite the continued pressures of the pandemic, consumer home-purchasing power has stayed strong as mortgage rates remain at record lows. Meanwhile, for-sale inventory has continued to dwindle, dropping 17% year over year in August, which created upward pressure on home price appreciation as buyers compete for the limited supply of homes.
Home price growth is expected to slow as greater availability of new and existing homes are placed for sale in 2021 and elevated unemployment saps buyer demand. The HPI Forecast shows prices will start to downshift in early 2021, with annual U.S. HPI gains slowing to just 0.2% by August 2021 and many locations experiencing a decline in prices.
emphasis added
Fed Chair Powell: Recent Economic Developments and the Challenges Ahead
by Calculated Risk on 10/06/2020 10:43:00 AM
The speech is available on youtube.
From Fed Chair Powell: Recent Economic Developments and the Challenges Ahead
We should continue do what we can to manage downside risks to the outlook. One such risk is that COVID-19 cases might again rise to levels that more significantly limit economic activity, not to mention the tragic effects on lives and well-being. Managing this risk as the expansion continues will require following medical experts' guidance, including using masks and social-distancing measures.
A second risk is that a prolonged slowing in the pace of improvement over time could trigger typical recessionary dynamics, as weakness feeds on weakness. A long period of unnecessarily slow progress could continue to exacerbate existing disparities in our economy. That would be tragic, especially in light of our country's progress on these issues in the years leading up to the pandemic.
The expansion is still far from complete. At this early stage, I would argue that the risks of policy intervention are still asymmetric. Too little support would lead to a weak recovery, creating unnecessary hardship for households and businesses. Over time, household insolvencies and business bankruptcies would rise, harming the productive capacity of the economy, and holding back wage growth. By contrast, the risks of overdoing it seem, for now, to be smaller. Even if policy actions ultimately prove to be greater than needed, they will not go to waste. The recovery will be stronger and move faster if monetary policy and fiscal policy continue to work side by side to provide support to the economy until it is clearly out of the woods.
BLS: Job Openings Decreased to 6.5 Million in August
by Calculated Risk on 10/06/2020 10:08:00 AM
From the BLS: Job Openings and Labor Turnover Summary
The number of job openings was little changed at 6.5 million on the last business day of August, the U.S. Bureau of Labor Statistics reported today. Hires were little changed at 5.9 million in August. Total separations decreased to 4.6 million. Within separations, the quits rate was little changed at 2.0 percent while the layoffs and discharges rate decreased to a series low of 1.0 percent.The following graph shows job openings (yellow line), hires (dark blue), Layoff, Discharges and other (red column), and Quits (light blue column) from the JOLTS.
emphasis added
This series started in December 2000.
Note: The difference between JOLTS hires and separations is similar to the CES (payroll survey) net jobs headline numbers. This report is for August, the most recent employment report was for September.
 Click on graph for larger image.
Note that hires (dark blue) and total separations (red and light blue columns stacked) are usually pretty close each month. This is a measure of labor market turnover. When the blue line is above the two stacked columns, the economy is adding net jobs - when it is below the columns, the economy is losing jobs.
The huge spikes in layoffs and discharges in March and April 2020 are labeled, but off the chart to better show the usual data.
Jobs openings decreased in August to 6.493 million from 6.697 million in July.
The number of job openings (yellow) were down 9.4% year-over-year.
Quits were down 21% year-over-year. These are voluntary separations. (see light blue columns at bottom of graph for trend for "quits").
Job openings decreased in August, and are down YoY - and quits are down sharply YoY.
Trade Deficit Increased to $67.1 Billion in August
by Calculated Risk on 10/06/2020 08:41:00 AM
From the Department of Commerce reported:
The U.S. Census Bureau and the U.S. Bureau of Economic Analysis announced today that the goods and services deficit was $67.1 billion in August, up $3.7 billion from $63.4 billion in July, revised.
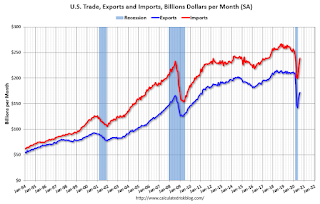
August exports were $171.9 billion, $3.6 billion more than July exports. August imports were $239.0 billion, $7.4 billion more than July imports.
emphasis added
 Click on graph for larger image.
Both exports and imports increased in August.
Exports are down 18% compared to August 2019; imports are down 8.5% compared to August 2019.
Both imports and exports decreased sharply due to COVID-19, and have now bounced back (imports more than exports),
The second graph shows the U.S. trade deficit, with and without petroleum.
 The blue line is the total deficit, and the black line is the petroleum deficit, and the red line is the trade deficit ex-petroleum products.
Note that the U.S. exported a slight net positive petroleum products in recent months.
Oil imports averaged $41.69 per barrel in August, up from $40.60 per barrel in July, and down from $58.57 in August 2019.
The trade deficit with China decreased to $29.8 billion in August, from $31.7 billion in August 2019.


