by Calculated Risk on 9/30/2020 09:42:00 PM
Wednesday, September 30, 2020
Thursday: Unemployment Claims, Personal Income and Outlays, ISM Mfg, Construction Spending, Vehicle Sales
Thursday:
• At 8:30 AM ET, The initial weekly unemployment claims report will be released. Initial claims were 870 thousand the previous week.
• Also at 8:30 AM, Personal Income and Outlays for August. The consensus is for a 2.2% decrease in personal income, and for a 0.7% increase in personal spending. And for the Core PCE price index to increase 0.3%.
• At 10:00 AM, ISM Manufacturing Index for September. The consensus is for a reading of 56.2, up from 56.0 in August.
• Also at 10:00 AM, Construction Spending for August. The consensus is for a 0.7% increase.
• All day: Light vehicle sales for September. The consensus is for sales of 16.2 million SAAR, up from 15.2 million SAAR in August (Seasonally Adjusted Annual Rate).
September 30 COVID-19 Test Results
by Calculated Risk on 9/30/2020 07:32:00 PM
The US is now mostly reporting 700 thousand to 1 million tests per day. Based on the experience of other countries, the percent positive needs to be well under 5% to really push down new infections (probably close to 1%), so the US still needs to increase the number of tests per day significantly (or take actions to push down the number of new infections).
There were 715,182 test results reported over the last 24 hours.
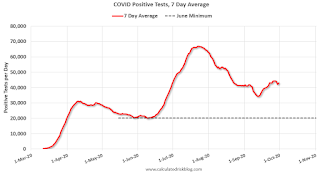
There were 44,391 positive tests.
Over 23,000 Americans died from COVID in September. See the graph on US Daily Deaths here.

This data is from the COVID Tracking Project.
The percent positive over the last 24 hours was 6.2% (red line is 7 day average).
For the status of contact tracing by state, check out testandtrace.com.
And check out COVID Exit Strategy to see how each state is doing.

The dashed line is the June low.
Note that there were very few tests available in March and April, and many cases were missed (the percent positive was very high - see first graph). By June, the percent positive had dropped below 5%.
If people stay vigilant, the number of cases might drop to the June low towards the end of October (that would still be a large number of new cases, but progress).
Fannie Mae: Mortgage Serious Delinquency Rate Increased in August
by Calculated Risk on 9/30/2020 04:18:00 PM
Fannie Mae reported that the Single-Family Serious Delinquency increased to 3.32% in August, from 3.24% in July. The serious delinquency rate is up from 0.67% in August 2019.
This is the highest serious delinquency rate since October 2012.
These are mortgage loans that are "three monthly payments or more past due or in foreclosure".
The Fannie Mae serious delinquency rate peaked in February 2010 at 5.59%.

By vintage, for loans made in 2004 or earlier (2% of portfolio), 5.79% are seriously delinquent (up from 5.57% in July). For loans made in 2005 through 2008 (3% of portfolio), 9.74% are seriously delinquent (up from 9.36%), For recent loans, originated in 2009 through 2018 (95% of portfolio), 2.86% are seriously delinquent (up from 2.79%). So Fannie is still working through a few poor performing loans from the bubble years.
Mortgages in forbearance are counted as delinquent in this monthly report, but they will not be reported to the credit bureaus.
This is very different from the increase in delinquencies following the housing bubble. Lending standards have been fairly solid over the last decade, and most of these homeowners have equity in their homes - and they will be able to restructure their loans once they are employed.
Note: Freddie Mac reported earlier.
Las Vegas Visitor Authority: No Convention Attendance, Visitor Traffic Down 57% YoY in August
by Calculated Risk on 9/30/2020 03:14:00 PM
From the Las Vegas Visitor Authority: August 2020 Las Vegas Visitor Statistics
With gradually more rooms opening and increased volume on weekends, the destination hosted over 1.5M visitors in August, down -57% from last year but up 6.9% from last month.Here is the data from the Las Vegas Convention and Visitors Authority.
The convention segment continued to register minimal measurable volume with continued mandated restrictions on group sizes.
With open properties representing an inventory of 127,657 rooms*, total occupancy reached 42.7% for the month as weekend occupancy improved to 63.1% while midweek occupancy reached 34.4%.
* Reflects weighted average of daily room tallies
 Click on graph for larger image.
 The blue and red bars are monthly visitor traffic (left scale) for 2019 and 2020. The dashed blue and orange lines are convention attendance (right scale).
Convention traffic in August was down 100% compared to July 2019.
And visitor traffic was down 57% YoY.
The casinos started to reopen on June 4th (it appears about 85% of rooms have now opened).
NAR: Pending Home Sales Increase 8.8% in August
by Calculated Risk on 9/30/2020 10:03:00 AM
From the NAR: Pending Home Sales Index Reaches Record High as Sales Ascend 8.8% in August
The Pending Home Sales Index (PHSI), a forward-looking indicator of home sales based on contract signings, rose 8.8% to 132.8 – a record high – in August. Year-over-year, contract signings rose 24.2%. An index of 100 is equal to the level of contract activity in 2001.This was above expectations for this index. Note: Contract signings usually lead sales by about 45 to 60 days, so this would usually be for closed sales in September and October.
...
The Northeast PHSI grew 4.3% to 117.1 in August, a 26.0% jump from a year ago. In the Midwest, the index rose 8.6% to 124.5 last month, up 25.0% from August 2019.
Pending home sales in the South increased 8.6% to an index of 154.2 in August, up 23.6% from August 2019. The index in the West rose 13.1% in August to 120.3, up 23.6% from a year ago.
emphasis added
Q2 GDP Revised up to -31.4% Annual Rate
by Calculated Risk on 9/30/2020 08:34:00 AM
From the BEA: Gross Domestic Product (Third Estimate), Corporate Profits (Revised), and GDP by Industry (Annual Update), Second Quarter 2020
Real gross domestic product (GDP) decreased at an annual rate of 31.4 percent in the second quarter of 2020, according to the "third" estimate released by the Bureau of Economic Analysis. In the first quarter, real GDP decreased 5.0 percent.From the BEA revision information, here is a Comparison of Third and Second Estimates. PCE growth was revised up to -33.2% from -34.6%. Residential investment was revised up from -37.9% to -35.6%. This was close to the consensus forecast.
The “third” estimate of GDP released today is based on more complete source data than were available for the "second" estimate issued last month. In the second estimate, the decrease in real GDP was 31.7 percent. The upward revision with the third estimate primarily reflected an upward revision to personal consumption expenditures (PCE) that was partly offset by downward revisions to exports and to nonresidential fixed investment.
emphasis added
ADP: Private Employment increased 749,000 in September
by Calculated Risk on 9/30/2020 08:19:00 AM
Private sector employment increased by 749,000 jobs from August to September according to the September ADP National Employment Report®. ... The report, which is derived from ADP’s actual payroll data, measures the change in total nonfarm private employment each month on a seasonally-adjusted basis.This was above the consensus forecast for 605 thousand private sector jobs added in the ADP report.
“The labor market continues to recover gradually,” said Ahu Yildirmaz, vice president and co-head of the ADP Research Institute. “In September, the majority of sectors and company sizes experienced gains with trade, transportation and utilities; and manufacturing leading the way. However, small businesses continued to demonstrate slower growth.
emphasis added
The BLS report will be released Friday, and the consensus is for 850 thousand non-farm payroll jobs added in September. Of course the ADP report has not been very useful in predicting the BLS report.
MBA: Mortgage Applications Decrease in Latest Weekly Survey
by Calculated Risk on 9/30/2020 07:00:00 AM
From the MBA: Mortgage Applications Decrease in Latest MBA Weekly Survey
Mortgage applications decreased 4.8 percent from one week earlier, according to data from the Mortgage Bankers Association’s (MBA) Weekly Mortgage Applications Survey for the week ending September 25, 2020.
... The Refinance Index decreased 7 percent from the previous week and was 52 percent higher than the same week one year ago. The seasonally adjusted Purchase Index decreased 2 percent from one week earlier. The unadjusted Purchase Index decreased 2 percent compared with the previous week and was 22 percent higher than the same week one year ago.
“Mortgage rates decreased last week, with the 30-year fixed rate mortgage declining 5 basis points to 3.05 percent – the lowest in MBA’s survey. Despite the decline in rates, refinances fell over 6 percent, driven by a 9 percent drop in conventional refinance applications,” said Joel Kan, MBA’s Associate Vice President of Economic and Industry Forecasting. “There are indications that refinance rates are not decreasing to the same extent as rates for home purchase loans, and that could explain last week’s decline in refinances. Many lenders are still operating at full capacity and working through operational challenges, ultimately limiting the number of applications they are able to accept.”
Added Kan, “Purchase applications also decreased last week, but activity was still at a strong year-overyear growth rate of 22 percent. Even as pent-up demand from earlier in the year wanes, there continues to be action in the higher price tiers, with the average loan balance remaining close to an all-time survey high.”
...
The average contract interest rate for 30-year fixed-rate mortgages with conforming loan balances ($510,400 or less) decreased to 3.05 percent from 3.10 percent, with points increasing to 0.52 from 0.46 (including the origination fee) for 80 percent loan-to-value ratio (LTV) loans.
emphasis added
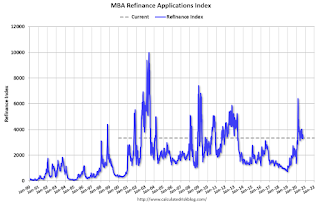
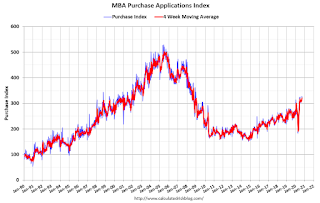
 Click on graph for larger image.
The first graph shows the refinance index since 1990.
The refinance index has been very volatile recently depending on rates and liquidity.
But with record low rates, the index is up significantly from last year.
 The second graph shows the MBA mortgage purchase index
According to the MBA, purchase activity is up 22% year-over-year unadjusted.
Note: Red is a four-week average (blue is weekly).
Tuesday, September 29, 2020
Wednesday: ADP Employment, Q2 GDP, Chicago PMI, Pending Home Sales
by Calculated Risk on 9/29/2020 09:24:00 PM
Wednesday:
• At 7:00 AM ET, The Mortgage Bankers Association (MBA) will release the results for the mortgage purchase applications index.
• At 8:15 AM, The ADP Employment Report for September. This report is for private payrolls only (no government). The consensus is for 605,000 jobs added, up from 428,000 in August.
• At 8:30 AM, Gross Domestic Product, 2nd quarter 2020 (Third estimate). The consensus is that real GDP decreased 31.7% annualized in Q2, unchanged from the second estimate of -31.7%.
• At 9:45 AM, Chicago Purchasing Managers Index for September. The consensus is for a reading of 52.0, up from 51.2 in August.
• At 10:00 AM, Pending Home Sales Index for August. The consensus is 3.2% increase in the index.
September 29 COVID-19 Test Results
by Calculated Risk on 9/29/2020 07:14:00 PM
The US is now mostly reporting over 700,000 tests per day. Based on the experience of other countries, the percent positive needs to be well under 5% to really push down new infections, so the US still needs to increase the number of tests per day significantly (or take actions to push down the number of new infections).
There were 744,476 test results reported over the last 24 hours.
There were 36,947 positive tests.
Over 22,000 Americans have died from COVID so far in September. See the graph on US Daily Deaths here.

This data is from the COVID Tracking Project.
The percent positive over the last 24 hours was 5.0% (red line is 7 day average).
For the status of contact tracing by state, check out testandtrace.com.
And check out COVID Exit Strategy to see how each state is doing.

The dashed line is the June low.
Note that there were very few tests available in March and April, and many cases were missed (the percent positive was very high - see first graph). By June, the percent positive had dropped below 5%.
If people stay vigilant, the number of cases might drop to the June low some time in October (that would still be a large number of new cases, but progress).


