by Calculated Risk on 4/21/2020 01:27:00 PM
Tuesday, April 21, 2020
Lawler: Las Vegas Home Sales Plunged in First Half of April
Housing economist Tom Lawler has been looking for high frequency data for housing.
Today, he sent me this story from the Las Vegas Review-Journal: Las Vegas housing market slows amid coronavirus turmoil
Lawler notes: According the above, net signed contracts for existing homes in the first half of April 2020 were down 57% from the comparable period of 2019 while net signed contracts for new homes in the first half of April of this year were down 79% from the comparable period of last year. (YOY gross sales contracts were down 47% for existing homes and down 60% for new homes).
Comments on March Existing Home Sales
by Calculated Risk on 4/21/2020 11:20:00 AM
Earlier: NAR: Existing-Home Sales Decreased to 5.27 million in March
A few key points:
1) This is mostly pre-crisis data. Existing home sales are counted at the close of escrow, so this report is mostly for contracts signed in January and February. Sales will decline sharply in April and May.
2) Existing home sales were up 0.8% year-over-year (YoY) in March.
2) Inventory is very low, and was down 10.2% year-over-year (YoY) in March. Inventory will probably stay low as people wait to list their homes - and do not want strangers in their house. This is the lowest level of inventory for March since at least the early 1990s.

Signed contracts will probably be down sharply year-over-year in April and May.
Note that existing home sales picked up somewhat in the second half of 2019 as interest rates declined.

Sales NSA in March (415,000) were just above sales last year in March.
Note that sales have been in the middle of the range recently - not absurdly high like in 2005, and not depressed like in 2010 and 2011.
With the pandemic, sales will decline sharply over the next few months.
NAR: Existing-Home Sales Decreased to 5.27 million in March
by Calculated Risk on 4/21/2020 10:13:00 AM
From the NAR: Home Sales Increase Year-Over-Year Despite Expected Monthly March Sales Decline Due to Impact of COVID-19
Existing-home sales fell in March following a February that saw significant nationwide gains, according to the National Association of Realtors®. Each of the four major regions reported a dip in sales, with the West suffering the largest decrease.
Total existing-home sales, completed transactions that include single-family homes, townhomes, condominiums and co-ops, dropped 8.5% from February to a seasonally-adjusted annual rate of 5.27 million in March. Despite the decline, overall sales increased year-over-year for the ninth straight month, up 0.8% from a year ago (5.23 million in March 2019).
...
Total housing inventory at the end of March totaled 1.50 million units, up 2.7% from February, but down 10.2% from one year ago (1.67 million). Unsold inventory sits at a 3.4-month supply at the current sales pace, up from three months in February and down from the 3.8-month figure recorded in March 2019.
emphasis added
 Click on graph for larger image.
This graph shows existing home sales, on a Seasonally Adjusted Annual Rate (SAAR) basis since 1993.
Sales in March (5.27 million SAAR) were down 8.5% from last month, and were 0.8% above the March 2019 sales rate.
The second graph shows nationwide inventory for existing homes.
 According to the NAR, inventory increased to 1.50 million in March from 1.46 million in February. Headline inventory is not seasonally adjusted, and inventory usually decreases to the seasonal lows in December and January, and peaks in mid-to-late summer.
The last graph shows the year-over-year (YoY) change in reported existing home inventory and months-of-supply. Since inventory is not seasonally adjusted, it really helps to look at the YoY change. Note: Months-of-supply is based on the seasonally adjusted sales and not seasonally adjusted inventory.
 Inventory was down 10.2% year-over-year in March compared to March 2019.
 Months of supply was increased to 3.4 months in March.
This was close to the consensus forecast. I'll have more later …
Monday, April 20, 2020
Tuesday: Existing Home Sales
by Calculated Risk on 4/20/2020 07:16:00 PM
Note: Existing home sales are counted at the close of escrow, so the report tomorrow is mostly for contracts signed in January and February. There was probably some fall off at the end of March due to COVID.
From Matthew Graham at Mortgage News Daily: Mortgage Rates Slightly Higher to Start The Week
While the industry has come to terms with recent challenges in terms of day-to-day volatility, mortgage rates remain higher than they otherwise would be based on financial markets. [MND's 30 Year Fixed (daily survey) 30YR FIXED - 3.44%]Tuesday:
emphasis added
• At 10:00 AM ET, Existing Home Sales for March from the National Association of Realtors (NAR). The consensus is for 5.30 million SAAR, down from 5.77 million.
Housing economist Tom Lawler expects the NAR to report sales of 5.25 million SAAR for March.
April 20 Update: US COVID-19 Test Results
by Calculated Risk on 4/20/2020 04:45:00 PM
Test-and-trace is a key criterion in starting to reopen the country. My current guess is test-and-trace will require around 300,000 tests per day at first since the US is far behind the curve. Some scientists believe we need around 800,000 tests per day.
Note: The Financial Times reports that Germany is doing more than 50,000 tests per day (with about one-fourth of the US population). That would be 200,000 in the US. I rounded up to 300,000 per day since the US is so behind on testing. But there are recommendations that Germany needs 200,000 tests per day to do test-and-trace. (800,000 adjusted for population).
This is just test results reported daily.
There were 137,687 test results reported over the last 24 hours.

This data is from the COVID Tracking Project.
The percent positive over the last 24 hours was 17% (red line). The US probably needs enough tests to push the percentage below 5% (probably much lower based on testing in New Zealand).
All experts agree: We need many more tests!
TSA checkpoint travel numbers
by Calculated Risk on 4/20/2020 03:24:00 PM
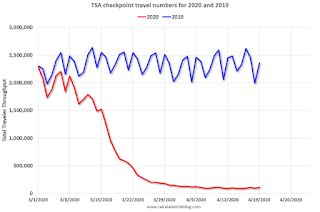
The TSA is providing daily travel numbers. (ht @conorsen)
This is another measure that will be useful to track when the economy starts to reopen.

This data shows the daily total traveler throughput from the TSA for 2019 (Blue) and 2020 (Red).
On April 19th there were 105,382 travelers compared to 2,356,802 a year ago.
That is a decline of 95%.
Hotels: Occupancy Rate Declined 69.8% Year-over-year to All Time Record Low
by Calculated Risk on 4/20/2020 09:30:00 AM
From HotelNewsNow.com: STR: US hotel results for week ending 11 April
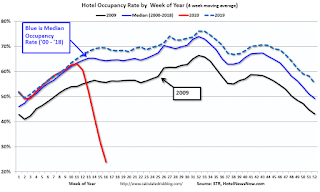
Reflecting the continued impact of the COVID-19 pandemic, the U.S. hotel industry reported significant year-over-year declines in the three key performance metrics during the week of 5-11 April 2020, according to data from STR.The following graph shows the seasonal pattern for the hotel occupancy rate using the four week average.
In comparison with the week of 7-13 April 2019, the industry recorded the following:
• Occupancy: -69.8% to 21.0%
• Average daily rate (ADR): -45.6% to US$74.18
• Revenue per available room (RevPAR): -83.6% to US$15.61
“There was not much of a change from last week. As we’ve noted, RevPAR declines of this severity are our temporary new normal,” said Jan Freitag, STR’s senior VP of lodging insights. “Several weeks of data also point to occupancy in the 20% range to be the low point, and economy hotels holding at a higher occupancy level is the pattern right now.”
emphasis added
 Click on graph for larger image.
The red line is for 2020, dash light blue is 2019, blue is the median, and black is for 2009 (the worst year probably since the Great Depression for hotels).
2020 was off to a solid start, however, COVID-19 has crushed hotel occupancy.
Note: Y-axis doesn't start at zero to better show the seasonal change.
This is the lowest weekly occupancy on record, even considering seasonality.
"Chicago Fed National Activity Index Suggests Economic Growth Decreased Substantially in March"
by Calculated Risk on 4/20/2020 09:00:00 AM
From the Chicago Fed: Chicago Fed National Activity Index Suggests Economic Growth Decreased Substantially in March
Led by declines in production- and employment-related indicators, the Chicago Fed National Activity Index (CFNAI) fell to –4.19 in March from +0.06 in February. All four broad categories of indicators used to construct the index made negative contributions in March, and three of the four categories decreased from February. The index’s three-month moving average, CFNAI-MA3, decreased to –1.47 in March from –0.20 in February. Following a period of economic expansion, an increasing likelihood of a recession has historically been associated with a CFNAI-MA3 value below –0.70.This graph shows the Chicago Fed National Activity Index (three month moving average) since 1967.
emphasis added
 Click on graph for larger image.
This suggests economic activity was in a recession starting in March (using the three-month average).
According to the Chicago Fed:
The index is a weighted average of 85 indicators of growth in national economic activity drawn from four broad categories of data: 1) production and income; 2) employment, unemployment, and hours; 3) personal consumption and housing; and 4) sales, orders, and inventories.
...
A zero value for the monthly index has been associated with the national economy expanding at its historical trend (average) rate of growth; negative values with below-average growth (in standard deviation units); and positive values with above-average growth.
Sunday, April 19, 2020
Sunday Night Futures
by Calculated Risk on 4/19/2020 07:33:00 PM
Weekend:
• Schedule for Week of April 19, 2020
Monday:
• At 8:30 AM ET, Chicago Fed National Activity Index for March. This is a composite index of other data.
From CNBC: Pre-Market Data and Bloomberg futures S&P 500 are down 14 and DOW futures are down 150 (fair value).
Oil prices were down over the last week with WTI futures at $17.19 per barrel and Brent at $27.77 barrel. A year ago, WTI was at $66, and Brent was at $71 - so WTI oil prices are down about 74% year-over-year.
Here is a graph from Gasbuddy.com for nationwide gasoline prices. Nationally prices are at $1.78 per gallon. A year ago prices were at $2.83 per gallon, so gasoline prices are down $1.05 per gallon year-over-year.
April 19 Update: US COVID-19 Test Results
by Calculated Risk on 4/19/2020 04:55:00 PM
Note: The Phase 4 Disaster Relief package is supposed to have $25 billion to increase testing.
Test-and-trace is a key criterion in starting to reopen the country. My current guess is test-and-trace will require around 300,000 tests per day at first since the US is far behind the curve. Some scientists believe we need around 800,000 tests per day.
Note: The Financial Times reports that Germany is doing more than 50,000 tests per day (with about one-fourth of the US population). That would be 200,000 in the US. I rounded up to 300,000 per day since the US is so behind on testing. But there are recommendations that Germany needs 200,000 tests per day to do test-and-trace. (800,000 adjusted for population).
This is just test results reported daily.
There were 167,330 test results reported over the last 24 hours.

This data is from the COVID Tracking Project.
The percent positive over the last 24 hours was 16% (red line). The US probably needs enough tests to push the percentage below 5% (probably much lower based on testing in New Zealand).
All experts agree: We need many more tests!


