by Calculated Risk on 4/07/2020 11:19:00 AM
Tuesday, April 07, 2020
Phase 4 Disaster Relief
Note: Most of what I proposed in early March was enacted. This includes Federal government adding to unemployment insurance (UI), expanding the coverage of UI, small business loans, free testing and care, and sending money to everyone (and much much more than I proposed). That was a start.
Now is the time to address Phase 4 of Disaster Relief. But first, a key point: This is disaster relief, not "stimulus". Many politicians and reporters are used to using the term "stimulus" for government packages. We are NOT trying to stimulate the economy, we are filling in an economic hole.
The first goal of disaster relief is to fight the virus. This includes any and all support for our healthcare workers and first responders, building up the supply chain of critical items like Personal Protection Equipment (PPE), and building a robust test-and-trace program that is a key to reopening parts of the economy.
The second goal of disaster relief is to fill the economic hole caused by the disaster. There has been a sudden stop in economic activity, however the financial world continues. Some people are advocating suspending paying bills, such as rents, mortgages, insurance, credit card, bond payments, and other bills during the crisis. This is a terrible idea. We don’t want to add a financial crisis, on top of an economic crisis, on top of a healthcare crisis. If we have a financial crisis too, it will be much hard to eventually reopen the economy.
We want to provide sufficient economic support during the crisis so that people can pay their bills. This should be the message from all politicians: Pay your bills.
For Phase 4, I'd suggest:
1. Another round of direct payments to households (send another $1,200 this month, and $1,200 next month).
2. Massive support for State and Local governments (Say $2,000 per person in each state).
3. Rent and mortgage assistance for individuals and small businesses. If the above isn't enough for people to keep paying their bills, then have a program that will provide short term assistance to help pay the bills.
In addition, we need to plan for a resurgence of the virus in the Fall (as Dr. Fauci has warned about). This includes building up PPE, having adequate masks for all citizens, supporting a robust test-and-trace program, and protecting our Democracy in the Fall. This includes preparing (and funding) to have mail-in voting in all 50 states in November if needed.
BLS: Job Openings decreased to 6.9 Million in February
by Calculated Risk on 4/07/2020 10:08:00 AM
Note: This is pre-crisis data.
From the BLS: Job Openings and Labor Turnover Summary
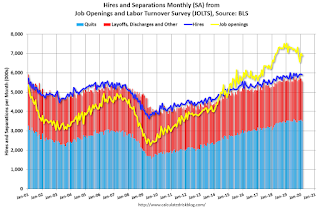
The number of job openings was little changed at 6.9 million on the last business day of February, the U.S. Bureau of Labor Statistics reported today. Over the month, hires and separations were little changed at 5.9 million and 5.6 million, respectively. Within separations, the quits rate was unchanged at 2.3 percent and the layoffs and discharges rate was little changed at 1.2 percent. ...The following graph shows job openings (yellow line), hires (dark blue), Layoff, Discharges and other (red column), and Quits (light blue column) from the JOLTS.
In February, the number of quits was little changed at 3.5 million while the rate was unchanged at 2.3 percent. Total private quits were little changed while the quits level edged up for government (+15,000). Quits decreased in real estate and rental and leasing (-27,000).
emphasis added
This series started in December 2000.
Note: The difference between JOLTS hires and separations is similar to the CES (payroll survey) net jobs headline numbers. This report is for February, the most recent employment report was for March.
 Click on graph for larger image.
Note that hires (dark blue) and total separations (red and light blue columns stacked) are pretty close each month. This is a measure of labor market turnover. When the blue line is above the two stacked columns, the economy is adding net jobs - when it is below the columns, the economy is losing jobs.
Jobs openings decreased in February to 6.882 million from 7.012 million in January.
The number of job openings (yellow) were down 2% year-over-year.
Quits were down 1% year-over-year. These are voluntary separations. (see light blue columns at bottom of graph for trend for "quits").
Job openings were at a solid level, but had been declining recently. Quits were mostly flat year-over-year.
However this was for February - the picture will change sharply in March and April.
CoreLogic: House Prices up 4.1% Year-over-year in February
by Calculated Risk on 4/07/2020 08:40:00 AM
Notes: This CoreLogic House Price Index report is for February. The recent Case-Shiller index release was for January. The CoreLogic HPI is a three month weighted average and is not seasonally adjusted (NSA).
From CoreLogic: CoreLogic Reports February Home Prices Increased by 4.1% Year Over Year
CoreLogic® ... today released the CoreLogic Home Price Index (HPI™) and HPI Forecast™ for February 2020, which shows home prices rose both year over year and month over month. Home prices increased nationally by 4.1% from February 2019. On a month-over-month basis, prices increased by 0.6% in February 2020. (January 2020 data was revised. Revisions with public records data are standard, and to ensure accuracy, CoreLogic incorporates the newly released public data to provide updated results each month.)
The CoreLogic HPI Forecast projects U.S. home prices to increase by 0.5% from February 2020 to March 2020. Homes that settle during March will largely reflect purchase contracts that were signed in January and February, before the coronavirus (COVID-19) outbreak. The CoreLogic HPI Forecast is a projection of home prices calculated using the CoreLogic HPI and other economic variables. (The HPI Forecast for February was produced with projections for economic variables available prior to mid-March and does not incorporate subsequent deterioration in the economy.)
“Before the onset of the pandemic, the quickening of home price growth during the first two months of 2020 highlighted the strength of purchase activity,” said Dr. Frank Nothaft, chief economist at CoreLogic. “In February, the national unemployment rate matched a 50-year low, mortgage rates fell to the lowest level in more than three years and for-sale inventory remained lean, all contributing to the pickup in value growth.”
“The nearly 10-year-old recovery of the U.S. housing market has run headlong into the panic and uncertainty from the global COVID-19 pandemic. In terms of home value trends, we are in uncharted territory as we battle the outbreak with measures that are generating a never-before-seen, rapid downshift in economic activity and employment. We expect that many homeowners will initially be somewhat cushioned by government programs, ultra-low interest rates or have adequate reserves to weather the storm. Over the second half of the year, we predict unemployment and other factors will become more pronounced, which will apply additional pressure on housing activity in the medium term.”, Frank Martell, President and CEO of CoreLogic
emphasis added
 Click on graph for larger image in graph gallery.
This graph from CoreLogic shows the YoY change in the index.
From CoreLogic: "This graph shows a comparison of the national year-over-year percent change for the CoreLogic HPI and CoreLogic Case-Shiller Index from 2000 to present month with forecasts one year into the future. We note that both the CoreLogic HPI Single Family Combined tier and the CoreLogic Case-Shiller Index are posting positive, but moderating year-over-year percent changes, and forecasting gains for the next year."
CR Note: The impact of COVID-19 on house prices will probably not show up for several months. The report next month will be for March, and that is for contracts signed in January and February. The overall impact on house prices will depend on the duration of the crisis.
Las Vegas Real Estate in March: Sales up 6.5% YoY, Inventory down 17% YoY
by Calculated Risk on 4/07/2020 08:00:00 AM
Note: Las Vegas will probably see a significant decline in visitor and convention traffic over the next several months due to COVID-19. This will likely have a significant impact on local real estate. Sales in March were solid, and prices were at a new high, however sales are counted when at the close of escrow, so the contracts for these homes were signed in January and February. The impact from COVID-19 will be in future months.
The Las Vegas Realtors reported Southern Nevada home prices set new record in March despite coronavirus crisis; LVR housing statistics for March 2020
The total number of existing local homes, condos and townhomes sold during March was 3,472. Compared to the same time last year, March sales were up 5.2% for homes and up 11.7% for condos and townhomes.1) Overall sales were up 6.5% year-over-year to 3,472 in March 2020 from 3,260 in March 2019.
...
By the end of March, LVR reported 5,687 single-family homes listed for sale without any sort of offer. That’s down 19.8% from one year ago. For condos and townhomes, the 1,628 properties listed without offers in March represented a 7.0% drop from one year ago.
…
Meanwhile, the number of so-called distressed sales in March remained near historically low levels. The association reported that short sales and foreclosures combined accounted for 2.0% of all existing local property sales in March. That compares to 2.5% of all sales one year ago, 2.9% two years ago, and 9.8% three years ago.
emphasis added
2) Active inventory (single-family and condos) is down from a year ago, from a total of 8,842 in March 2019 to 7,315 in March 2020. Note: Total inventory was down 17.3% year-over-year. And months of inventory is still low.
3) Low level of distressed sales.
Monday, April 06, 2020
Tuesday: Job Openings
by Calculated Risk on 4/06/2020 08:16:00 PM
More pre-crisis data.
Tuesday:
• At 8:00 AM ET, Corelogic House Price index for February.
• At 10:00 AM, Job Openings and Labor Turnover Survey for February from the BLS.
• At 3:00 PM, Consumer Credit from the Federal Reserve.
April 6 Update: US COVID-19 Test Results
by Calculated Risk on 4/06/2020 05:21:00 PM
Note: the large increase Saturday in test results reported was due to California working through the backlog of pending tests.
Test-and-trace is a key criteria in starting to reopen the country. My current guess is test-and-trace will require around 300,000 tests per day at first since the US is far behind the curve. Some scientists believe we need around 800,000 tests per day.
Notes: Data for the previous couple of days is updated and revised, so graphs might change.
Also, I'm no longer including pending tests. So this is just test results reported daily.
There were 155,063 test results reported over the last 24 hours.

This data is from the COVID Tracking Project.
The percent positive over the last 24 hours was 19% (red line). The US needs enough tests to push the percentage below 5% (probably much lower).
Test. Test. Test. Protect healthcare workers first!
U.S. Heavy Truck Sales down 43% Year-over-year in March
by Calculated Risk on 4/06/2020 01:53:00 PM
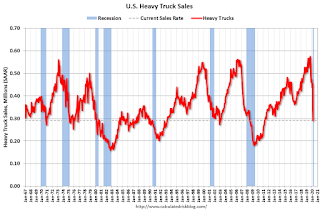
The following graph shows heavy truck sales since 1967 using data from the BEA. The dashed line is the March 2020 seasonally adjusted annual sales rate (SAAR).
Heavy truck sales really collapsed during the great recession, falling to a low of 180 thousand SAAR in May 2009. Then heavy truck sales increased to a new all time high of 575 thousand SAAR in September 2019.
Click on graph for larger image.
However heavy truck sales started declining late last year due to lower oil prices.
And then heavy truck sales really declined at the end of March due to COVID-19 and the collapse in oil prices.
Heavy truck sales were at 291 thousand SAAR in March, down from 453 thousand SAAR in February, and down 43% from 514 thousand SAAR in March 2019.
Heavy truck sales in April will likely be below the low of 180 thousand SAAR in May 2009, and probably below the record low of 159 thousand SAAR in 1982.
TSA checkpoint travel numbers
by Calculated Risk on 4/06/2020 10:49:00 AM
The TSA is providing daily travel numbers. (ht @conorsen)
This is another measure that will be useful to track when the economy starts to reopen.

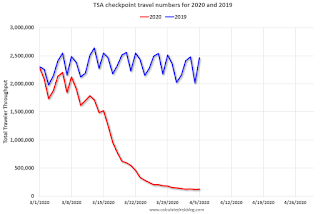
This data shows the daily total traveler throughput from the TSA for 2019 (Blue) and 2020 (Red).
On April 5th there were 122,029 travelers compared to 2,462,929 a year ago.
That is a decline of 95%.
Update: Framing Lumber Future Prices Down 25% Year-over-year
by Calculated Risk on 4/06/2020 09:24:00 AM
Here is another monthly update on framing lumber prices. Lumber prices declined sharply from the record highs in early 2018, and then increased until the COVID-19 crisis.
This graph shows two measures of lumber prices: 1) Framing Lumber from Random Lengths through Apr 3, 2020 (via NAHB), and 2) CME framing futures.

Right now Random Lengths prices are unchanged from a year ago, and CME futures are down 25% year-over-year.
There is a seasonal pattern for lumber prices, and usually prices will increase in the Spring, and peak around May, and then bottom around October or November - although there is quite a bit of seasonal variability.
The trade war led to significant volatility in lumber prices in 2018. Prices have fallen sharply due to COVID-19 (Note: Construction is considered an essential activity is ongoing in many areas)
Sunday, April 05, 2020
Sunday Night Futures
by Calculated Risk on 4/05/2020 06:49:00 PM
Weekend:
• Schedule for Week of April 5, 2020
Monday:
• No major economic releases scheduled.
From CNBC: Pre-Market Data and Bloomberg futures S&P 500 are up 37 and DOW futures are up 275 (fair value).
Oil prices were up over the last week with WTI futures at $26.19 per barrel and Brent at $31.97 barrel. A year ago, WTI was at $63, and Brent was at $70 - so oil prices are down by more than 50% year-over-year.
Here is a graph from Gasbuddy.com for nationwide gasoline prices. Nationally prices are at $1.92 per gallon. A year ago prices were at $2.73 per gallon, so gasoline prices are down 81 cents per gallon year-over-year.


