 RSS Feed
 by Calculated Risk on 4/02/2020 05:37:00 PM
Thursday, April 02, 2020
April 2 Update: US COVID-19 Test Results per Day; More Testing Needed
The testing shortfall continues. We need someone in charge resolving any bottleneck issues - PPE, manpower, swabs, reagents - whatever the issue, someone needs to be fixing it.
Test-and-trace is a key criteria in starting to reopen the country. My current guess is test-and-trace will require around 300,000 tests per day at first since the US is far behind the curve.
Notes: Data for the previous couple of days is updated and revised, so graphs might change.
Also, I'm no longer including pending tests. So this is just test results reported daily.
There were 103,940 test results reported over the last 24 hours.
 Click on graph for larger image.
This data is from the COVID Tracking Project.
The percent positive over the last 24 hours was 26% (red line - going the wrong way).
Test. Test. Test. Protect healthcare workers first!
Goldman: March Payrolls Preview
by Calculated Risk on 4/02/2020 04:45:00 PM
A few brief excerpts from a note by Goldman Sachs economist Spencer Hill:
We estimate nonfarm payrolls declined 180k in March, below consensus of -100k.
...
We estimate the unemployment rate rose three tenths to 3.8%, with risks skewed towards a larger increase (consensus 3.8%).
…
While we look for a weaker-than-consensus report tomorrow, the March employment numbers are already fairly stale and insignificant in our view, because the April report will likely show job losses in the millions.
emphasis added
March Employment Preview
by Calculated Risk on 4/02/2020 12:22:00 PM
Important Notes:
1. The BLS reference week includes the 12th of the month. Massive COVID-19 layoffs started after the reference week (although there was a pickup in layoffs during the reference week).
2. Watch for Special Notes in the release. There could be some important announcements on how the BLS will be handling unemployment numbers and seasonal adjustments.
3. The 2020 Decennial Census was expected to increase hiring in March. This is unclear now - some of the hiring will be delayed.
On Friday at 8:30 AM ET, the BLS will release the employment report for March. The consensus is for a decrease of 100,000 non-farm payroll jobs, and for the unemployment rate to increase to 3.9%.
Last month, the BLS reported 273,000 jobs added in February (266,000 ex-Census).
Here is a summary of recent data:
• The ADP employment report showed a decrease of 27,000 private sector payroll jobs in March. This was above consensus expectations of 154,000 private sector payroll jobs lost. The ADP report hasn't been very useful in predicting the BLS report for any one month, but in general, this suggests employment growth somewhat above expectations.
• The ISM manufacturing employment index decreased in March to 43.8%. A historical correlation between the ISM manufacturing employment index and the BLS employment report for manufacturing, suggests that private sector BLS manufacturing payroll decreased around 55,000 in March. The ADP report indicated manufacturing jobs increased 6,000 in March.
The ISM non-manufacturing employment index has not been released yet.
• Initial weekly unemployment claims averaged 2.6 million in March, way up from 213,000 in February. For the BLS reference week (includes the 12th of the month), initial claims were at 282,000, up from 211,000 during the reference week the previous month.
This suggests more layoffs (during the reference week) in March than in February.
• The final March University of Michigan consumer sentiment index decreased to 89.1 from the February reading of 101.0. Sentiment is frequently coincident with changes in the labor market, but there are other factors too like gasoline prices and politics. The decline this month was related to the pandemic.
• The BofA job tracker decreased in March to 103,000, down from 144,000 in February, suggesting fewer jobs added in March. However, according to the BofA, this data is "stale".
• Weather: The weather was favorable in both January and February. It is likely some expected hiring for March was pulled forward to the previous two months, suggesting some payback in the March report. So there was some chance that the March report would have been weaker than many expected without COVID-19.
• Conclusion: If we look back at 2005, when weekly claims for the reference week jumped following hurricane Katrina (similar to what happened in March), the economy lost 35 thousand jobs. It is possible that job losses will be that small in the March report - it is also possible that losses could be well over 100K. One thing is clear, job losses in the April report will be off the chart.
Hotels: Occupancy Rate Declined 67% Year-over-year to All Time Record Low
by Calculated Risk on 4/02/2020 11:29:00 AM
From HotelNewsNow.com: STR: US hotel results for week ending 28 March
Reflecting the continued impact of the COVID-19 pandemic, the U.S. hotel industry reported significant year-over-year declines in the three key performance metrics during the week of 22-28 March 2020, according to data from STR.The following graph shows the seasonal pattern for the hotel occupancy rate using the four week average.
In comparison with the week of 24-30 March 2019, the industry recorded the following:
• Occupancy: -67.5% to 22.6%
• Average daily rate (ADR): -39.4% to US$79.92
• Revenue per available room (RevPAR): -80.3% to US$18.05
“Year-over-year declines of this magnitude will unfortunately be the ‘new normal’ until the number of new COVID-19 cases slows significantly,” said Jan Freitag, STR’s senior VP of lodging insights. “Occupancy continues to fall to unprecedented lows, with more than 75% of rooms empty around the nation last week. As projected in our U.S. forecast revision, 2020 will be the worst year on record for occupancy. We do, however, expect the industry to begin to recover once the economy reignites and travel resumes.”
emphasis added
 Click on graph for larger image.
The red line is for 2020, dash light blue is 2019, blue is the median, and black is for 2009 (the worst year probably since the Great Depression for hotels).
2020 was off to a solid start, however, COVID-19 has crushed hotel occupancy.
This is the lowest weekly occupancy on record, even considering seasonality. Note the graph is a 4-week average.
BEA: March Vehicles Sales decreased to 11.4 Million SAAR
by Calculated Risk on 4/02/2020 09:28:00 AM
The BEA released their estimate of March vehicle sales this morning. The BEA estimated light vehicle sales of 11.37 million SAAR in March 2020 (Seasonally Adjusted Annual Rate), down 32.1% from the revised February sales rate, and down 34.1% from March 2019.
Sales in February were revised down from 16.83 million SAAR to 16.73 million SAAR.
 Click on graph for larger image.
This graph shows light vehicle sales since 2006 from the BEA (blue) and an estimate for March 2020 (red).
My view - before the health crisis - was that sales would move mostly sideways at near record levels this year. Going forward, the impact of COVID-19 will be significant.
The second graph shows light vehicle sales since the BEA started keeping data in 1967.
 Note: dashed line is current estimated sales rate of 11.37 million SAAR.
Sales collapsed in the second half of March, and will really collapse in April - and will fall below the lowest point of the Great Recession of 9.0 million SAAR.
Trade Deficit decreased to $39.9 Billion in February
by Calculated Risk on 4/02/2020 09:11:00 AM
Note: This data was for February and the outbreak of COVID-19 likely impacted trade with China.
From the Department of Commerce reported:
The U.S. Census Bureau and the U.S. Bureau of Economic Analysis announced today that the goods and services deficit was $39.9 billion in February, down $5.5 billion from $45.5 billion in January, revised.
February exports were $207.5 billion, $0.8 billion less than January exports. February imports were $247.5 billion, $6.3 billion less than January imports
emphasis added
 Click on graph for larger image.
Both exports and imports decreased in January.
Exports are 26% above the pre-recession peak and down slightly compared to February 2019; imports are 7% above the pre-recession peak, and down 5% compared to February 2019.
In general, trade both imports and exports have moved more sideways or down recently.
The second graph shows the U.S. trade deficit, with and without petroleum.
 The blue line is the total deficit, and the black line is the petroleum deficit, and the red line is the trade deficit ex-petroleum products.
Note that the U.S. exported a slight net positive petroleum products in recent months.
Oil imports averaged $57.24 per barrel in February, down from $61.93 in January, and down from $57.70 in February 2019.
The trade deficit with China decreased to $16.0 billion in February, from $24.8 billion in February 2019.
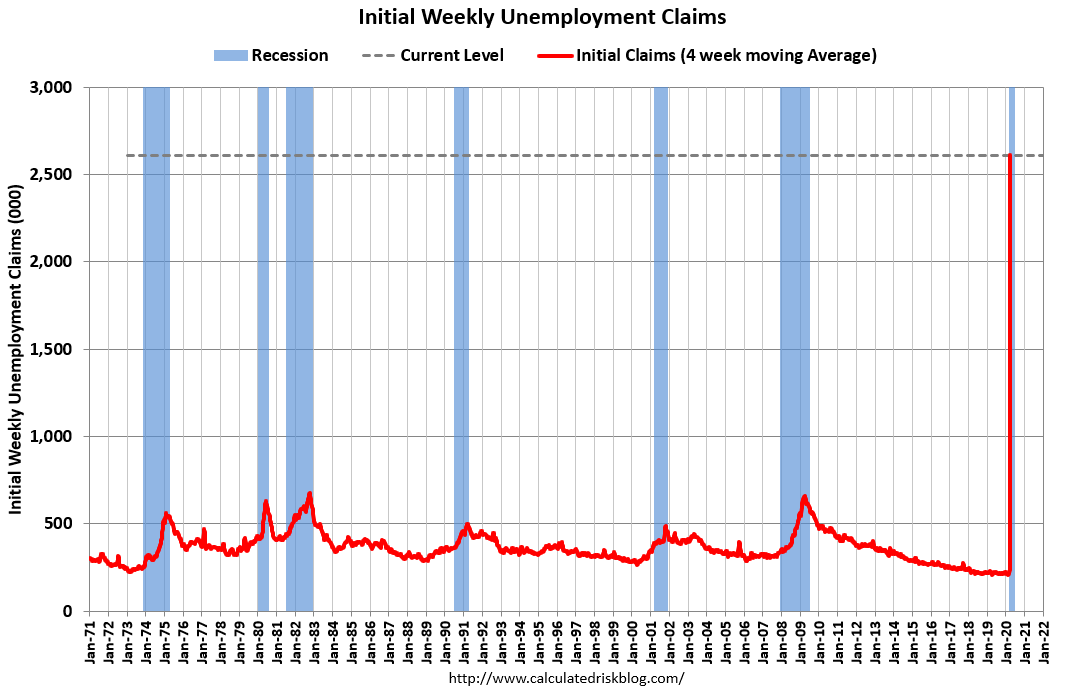
Weekly Initial Unemployment Claims Increase to 6,648,000
by Calculated Risk on 4/02/2020 08:35:00 AM
The DOL reported:
In the week ending March 28, the advance figure for seasonally adjusted initial claims was 6,648,000, an increase of 3,341,000 from the previous week's revised level. This marks the highest level of seasonally adjusted initial claims in the history of the seasonally adjusted series. The previous week's level was revised up by 24,000 from 3,283,000 to 3,307,000. The 4-week moving average was 2,612,000, an increase of 1,607,750 from the previous week's revised average. The previous week's average was revised up by 6,000 from 998,250 to 1,004,250.The previous week was revised up.
emphasis added
The following graph shows the 4-week moving average of weekly claims since 1971.
 Click on graph for larger image.
The dashed line on the graph is the current 4-week average. The four-week average of weekly unemployment claims increased to 2,612,000.
This was much higher than the consensus forecast.
The second graph shows seasonally adjust continued claims since 1967 (lags initial by one week while increasing sharply).
 At the worst of the Great Recession, continued claims peaked at 6.635 million, but then steadily declined.
Over the next few weeks, continued claims will increase rapidly to a new record high, and then will likely stay at that high level until the crisis abates.
Wednesday, April 01, 2020
Thursday: Unemployment Claims, Trade Deficit
by Calculated Risk on 4/01/2020 10:43:00 PM
Thursday:
• At 8:30 AM, The initial weekly unemployment claims report will be released. The consensus is for a 3.000 million initial claims, down from 3.283 million the previous week.
• At 8:30 AM, Trade Balance report for January from the Census Bureau. The consensus is the trade deficit to be $40.0 billion. The U.S. trade deficit was at $45.3 billion in January.
• Early, BEA Light vehicle sales for March. The consensus is for light vehicle sales to be 11.9 million SAAR in March, down from 16.8 million in February (Seasonally Adjusted Annual Rate).
April 1 Update: US COVID-19 Tests per Day; More Testing Needed
by Calculated Risk on 4/01/2020 05:39:00 PM
There is still far too little testing in the U.S.
We need:
1) More testing.
2) Better reporting (all tests, positive and negative).
3) A national test-and-trace program. Name the head of the program now - so that person can update everyone on the progress.
Test-and-trace is a key criteria in starting to reopen the country. My current guess is test-and-trace will require around 300,000 tests per day at first since the US is far behind the curve.
Notes: Data for the previous couple of days is updated and revised, so graphs might change.
Also, I include all tests in the total including pending.
The percent positive excludes the pending tests.
There were 101,147 tests reported over the last 24 hours.
 Click on graph for larger image.
This data is from the COVID Tracking Project.
The percent positive over the last 24 hours was 26% (red line - going the wrong way).
Testing must continue to be expanded until the percent positive declines to 5% or lower. This is based on results from South Korea.
Test. Test. Test. Protect healthcare workers first!
Zillow Case-Shiller February Forecast: "Ancient History"
by Calculated Risk on 4/01/2020 02:38:00 PM
The Case-Shiller house price indexes for January were released yesterday. Zillow forecasts Case-Shiller a month early, and I like to check the Zillow forecasts since they have been pretty close.
From Matthew Speakman at Zillow: January Case-Shiller Results & February Forecast: Ancient History
It may have been only two months ago, but in many ways it might as well be ancient history. ...
The national Case-Shiller Home Price Index rose 3.9% year-over-year in January. The smaller 10- and 20-city composite indices grew more slowly, at 2.6% and 3.1% year-over-year, respectively.
emphasis added
 The Zillow forecast is for the year-over-year change for the Case-Shiller National index to be at 4.0% in February, up from 3.9% in January.
 The Zillow forecast is for the 20-City index to be up 3.2% YoY in February from 3.1% in January, and for the 10-City index to increase to 2.7% YoY compared to 2.6% YoY in January.
But this is all "ancient history".


