by Calculated Risk on 2/18/2020 10:04:00 AM
Tuesday, February 18, 2020
NAHB: Builder Confidence Decreased to 74 in February
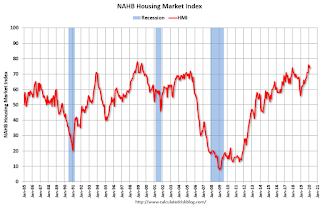
The National Association of Home Builders (NAHB) reported the housing market index (HMI) was at 74, down from 75 in January. Any number above 50 indicates that more builders view sales conditions as good than poor.
From NAHB: Builder Confidence Remains Solid in February
Builder confidence in the market for newly-built single-family homes edged one point lower to 74 in February, according to the latest NAHB/Wells Fargo Housing Market Index (HMI) released today. The last three monthly readings mark the highest sentiment levels since December 2017.
“Steady job growth, rising wages and low interest rates are fueling demand but builders are still grappling with increasing construction and development costs,” said NAHB Chairman Dean Mon.
“At a time when demand is on the rise, regulatory constraints along with a shortage of construction workers and a dearth of lots are hindering the production of affordable housing in local communities across the nation,” said NAHB Chief Economist Robert Dietz. “And while lower mortgage rates have improved housing affordability in recent months, accelerating price growth due to limited inventory may offset some of that effect.”
...
The HMI index gauging current sales conditions fell one point to 80, the component measuring sales expectations in the next six months was one point lower at 79 and the gauge charting traffic of prospective buyers also decreased one point to 57.
Looking at the three-month moving averages for regional HMI scores, the Northeast rose one point to 63, the Midwest increased one point to 67 and the South moved two points higher to 78. The West fell one point to 83.
emphasis added
 Click on graph for larger image.
This graph show the NAHB index since Jan 1985.
This was slightly below the consensus forecast, but still another very strong reading.
NY Fed: Manufacturing "Business activity picked up in New York State"
by Calculated Risk on 2/18/2020 08:56:00 AM
From the NY Fed: Empire State Manufacturing Survey
Business activity picked up in New York State, according to firms responding to the February 2020 Empire State Manufacturing Survey. The headline general business conditions index moved up eight points to 12.9. The new orders index shot up 16 points to 22.1, and the shipments index climbed to 18.9.This was higher than the consensus forecast.
...
The index for number of employees edged down to 6.6, indicating that employment grew to a small degree. The average workweek held near zero, a sign that the average workweek was little changed.
…
Indexes assessing the six-month outlook suggested that optimism about future conditions was somewhat restrained.
emphasis added
Monday, February 17, 2020
Tuesday: Empire State Mfg Survey, Homebuilder Survey
by Calculated Risk on 2/17/2020 06:02:00 PM
Weekend:
• Schedule for Week of February 16, 2020
Tuesday:
• At 8:30 AM ET, The New York Fed Empire State manufacturing survey for February. The consensus is for a reading of 5.0, up from 4.8.
• At 10:00 AM, The February NAHB homebuilder survey. The consensus is for a reading of 75, unchanged from 75. Any number above 50 indicates that more builders view sales conditions as good than poor.
From CNBC: Pre-Market Data and Bloomberg futures: S&P 500 are up 8 and DOW futures are up 75 (fair value).
Oil prices were up over the last week with WTI futures at $52.33 per barrel and Brent at $57.61 barrel. A year ago, WTI was at $54, and Brent was at $66 - so oil prices are down year-over-year.
Here is a graph from Gasbuddy.com for nationwide gasoline prices. Nationally prices are at $2.43 per gallon. A year ago prices were at $2.31 per gallon, so gasoline prices are up 12 cents per gallon year-over-year.
Update: Real Estate Agent Boom and Bust
by Calculated Risk on 2/17/2020 01:36:00 PM
Way back in 2005, I posted a graph of the Real Estate Agent Boom. Here is another update to the graph.
The graph shows the number of real estate licensees in California.
The number of agents peaked at the end of 2007 (housing activity peaked in 2005, and prices in 2006).
The number of salesperson's licenses is off 26% from the peak, and is increasing again (up 11% from low). The number of salesperson's licenses has increased to December 2004 levels.
Brokers' licenses are off 14.3% from the peak and have fallen to December 2005 levels, and may be bottoming.

We are seeing a pickup in Real Estate licensees in California, although the number of Brokers is mostly flat.
The Housing Bubble, Mortgage Debt as Percent of GDP
by Calculated Risk on 2/17/2020 10:27:00 AM
Three years ago, on Presidents' Day, I excerpted from a post I wrote in February 2005 (yes, 15 years ago).
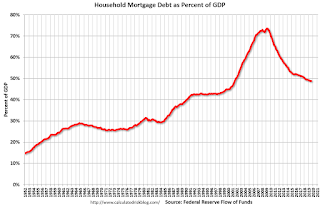
In that 2005 post, I included a graph of household mortgage debt as a percent of GDP. Several readers asked if I could update the graph.
First, from 2005:
The following chart shows household mortgage debt as a % of GDP. Although mortgage debt has been increasing for years, the last four years have seen a tremendous increase in debt. Last year alone mortgage debt increased close to $800 Billion - almost 7% of GDP. ...CR Note: And a serious problem is what happened!
Many homeowners have refinanced their homes, in essence using their homes as an ATM.
It wouldn't take a RE bust to impact the general economy. Just a slowdown in both volume (to impact employment) and in prices (to slow down borrowing) might push the general economy into recession. An actual bust, especially with all of the extensive sub-prime lending, might cause a serious problem.
 The second graph shows household mortgage debt as a percent of GDP through Q3 2019. Hopefully the graphs have improved!
The "bubble" is pretty obvious on this graph, and the sharp increase in mortgage debt was one of the warning signs.
Sunday, February 16, 2020
Fannie and Freddie: REO inventory declined in Q4, Down 17% Year-over-year
by Calculated Risk on 2/16/2020 11:57:00 AM
Fannie and Freddie earlier reported results last week for Q4 2019. Here is some information on Real Estate Owned (REOs).
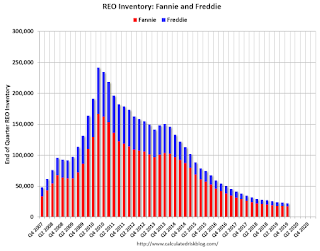
Freddie Mac reported the number of REO declined to 4,989 at the end of Q4 2019 compared to 7,100 at the end of Q4 2018.
For Freddie, this is down 93% from the 74,897 peak number of REOs in Q3 2010.
Fannie Mae reported the number of REO declined to 17,501 at the end of Q4 2019 compared to 20,156 at the end of Q4 2018.
For Fannie, this is down 90% from the 166,787 peak number of REOs in Q3 2010.

Here is a graph of Fannie and Freddie Real Estate Owned (REO).
REO inventory decreased in Q4 2019, and combined inventory is down 17% year-over-year.
This is close to normal levels of REOs.
Saturday, February 15, 2020
Schedule for Week of February 16, 2020
by Calculated Risk on 2/15/2020 08:11:00 AM
The key reports this week are January Housing Starts and Existing Home sales.
For manufacturing, the February NY and Philly Fed manufacturing surveys will be released this week.
All US markets will be closed in observance of Washington's Birthday Holiday.
8:30 AM: The New York Fed Empire State manufacturing survey for February. The consensus is for a reading of 5.0, up from 4.8.
10:00 AM: The February NAHB homebuilder survey. The consensus is for a reading of 75, unchanged from 75. Any number above 50 indicates that more builders view sales conditions as good than poor.
7:00 AM ET: The Mortgage Bankers Association (MBA) will release the results for the mortgage purchase applications index.
 8:30 AM: Housing Starts for January.
 This graph shows single and total housing starts since 1968.
The consensus is for 1.415 million SAAR, down from 1.608 million SAAR.
8:30 AM ET: The Producer Price Index for December from the BLS. The consensus is for a 0.1% increase in PPI, and a 0.1% increase in core PPI.
During the day: The AIA's Architecture Billings Index for January (a leading indicator for commercial real estate).
2:00 PM: FOMC Minutes, Meeting of January 28-29, 2020
8:30 AM: The initial weekly unemployment claims report will be released. The consensus is for 210 thousand initial claims, up from 205 thousand the previous week.
8:30 AM: the Philly Fed manufacturing survey for February. The consensus is for a reading of 12.0, down from 17.0.
 10:00 AM: Existing Home Sales for January from the National Association of Realtors (NAR). The consensus is for 5.45 million SAAR, down from 5.54 million.
The graph shows existing home sales from 1994 through the report last month.
Friday, February 14, 2020
Census: A Changing Nation: Population Projections Under Alternative Immigration Scenarios
by Calculated Risk on 2/14/2020 03:16:00 PM
Note: Housing economist Tom Lawler was been way ahead on this, see for example: Lawler: Updated “Demographic” Outlook Using Recent Population Estimates by Age, Lawler: “Off-Calendar” Census Population Projection Update Coming; To Include Alternative Migration Scenarios, Lawler: US Population Growth Slowed Again in 2019.
From the Census Bureau: A Changing Nation: Population Projections Under Alternative Immigration Scenarios
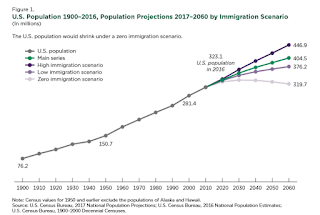
Higher international immigration over the next four decades would produce a faster growing, more diverse, and younger population for the United States. In contrast, an absence of migration into the country over this same period would result in a U.S. population that is smaller than the present. Different levels of immigration between now and 2060 could change the projection of the population in that year by as much as 127 million people, with estimates ranging anywhere from 320 to 447 million U.S. residents.
…
The 2017 National Projections main series, released in September 2018, present one scenario for the future population. These projections will only hold true if the assumptions about births, deaths, and migration match the actual trends in these components of population change. International migration is difficult to project because political and economic conditions are nearly impossible to anticipate, yet factor heavily into migration movements into and out of a country. While we do not attempt to predict future policy or economic cycles, we do recognize the uncertainty surrounding migration and the impact that different migration outcomes could have on the future population. To account for this, we have produced three alternate sets of projections that use the same methodology and assumptions for fertility, mortality, and emigration, but differ in the levels of immigration that they assume: high, low, and zero immigration. This report compares the results from the three alternative scenarios of projections and the main series, focusing on differences in the pace at which the U.S. population grows, diversifies, and ages.
 Click on graph for larger image.
This graph is from the Census Bureau report.
Based on Lawler's recent analysis of births, deaths, and immigration, these projections are probably optimistic.
Depending on the which scenario happens, this could have a significant impact on the US economy and especially housing - and is a key reason the future is not as bright as it was a few years ago.
Sacramento Housing in January: Sales Up 5.6% YoY, Active Inventory down 32.7% YoY
by Calculated Risk on 2/14/2020 01:25:00 PM
From SacRealtor.org: January 2020 Statistics – Sacramento Housing Market – Single Family Homes
January ended with 944 sales, down 24.1% from December. Compared to one year ago (894), the current figure is up 5.6%.1) Overall sales increased to 944 in January, up from 894 in January 2019. Sales were down from December 2019 (previous month), and up 5.6% from January 2019.
...
The Active Listing Inventory increased 7.1% from December to January, from 1,315 units to 1,409 units. Compared with January 2019 (2,095), inventory is down 32.7%. The Months of Inventory increased from 1.1 to 1.5 Months. This figure represents the amount of time (in months) it would take for the current rate of sales to deplete the total active listing inventory.
...
The Median DOM (days on market) decreased from 19 to 17 and the Average DOM increased from 32 to 33. “Days on market” represents the days between the initial listing of the home as “active” and the day it goes “pending.”
emphasis added
2) Active inventory was at 1,409, down from 2,095 in January 2019. That is down 32.7% year-over-year. This is the ninth consecutive month with a YoY decline in inventory, following 20 months of YoY increases in inventory.
Q1 GDP Forecasts: 0.7% to 2.4%
by Calculated Risk on 2/14/2020 11:42:00 AM
From Merrill Lynch:
The data cut our 4Q 2019 GDP tracking estimate by 0.1pp to 2.0% and our 1Q 2020 estimate by 0.3pp to 0.7% qoq saar. [Feb 14 estimate]From the NY Fed Nowcasting Report
emphasis added
The New York Fed Staff Nowcast stands at 1.4% for 2020:Q1. News from this week’s data decreased the nowcast for 2020:Q1 by 0.3 percentage point. [Feb 14 estimate]And from the Altanta Fed: GDPNow
The GDPNow model estimate for real GDP growth (seasonally adjusted annual rate) in the first quarter of 2020 is 2.4 percent on February 14, down from 2.7 percent on February 7. [Feb 14 estimate]CR Note: These early estimates suggest real GDP growth will be between 0.7% and 2.4% annualized in Q1.


