by Calculated Risk on 3/15/2019 10:12:00 AM
Friday, March 15, 2019
BLS: Job Openings Increased to 7.6 Million in January
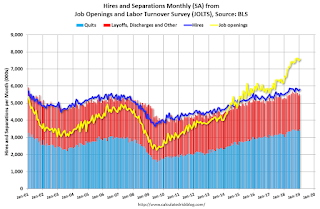
Notes: In January there were 7.581 million job openings, and, according to the January Employment report, there were 6.535 million unemployed. So, for the eleventh consecutive month, there were more job openings than people unemployed. Also note that the number of job openings has exceeded the number of hires since January 2015 (4 years).
From the BLS: Job Openings and Labor Turnover Summary
The number of job openings was little changed at 7.6 million on the last business day of January, the U.S. Bureau of Labor Statistics reported today. Over the month, hires and separations were little changed at 5.8 million and 5.6 million, respectively. Within separations, the quits rate was unchanged at 2.3 percent and the layoffs and discharges rate was little changed at 1.1 percent. ...The following graph shows job openings (yellow line), hires (dark blue), Layoff, Discharges and other (red column), and Quits (light blue column) from the JOLTS.
The number of quits was little changed in January at 3.5 million. The quits rate was 2.3 percent. The quits level was little changed for total private but increased for government
emphasis added
This series started in December 2000.
Note: The difference between JOLTS hires and separations is similar to the CES (payroll survey) net jobs headline numbers. This report is for January, the most recent employment report was for February.
 Click on graph for larger image.
Note that hires (dark blue) and total separations (red and light blue columns stacked) are pretty close each month. This is a measure of labor market turnover. When the blue line is above the two stacked columns, the economy is adding net jobs - when it is below the columns, the economy is losing jobs.
Jobs openings increased in January to 7.581 million from 7.479 million in December.
The number of job openings (yellow) are up 15% year-over-year.
Quits are up 15% year-over-year. These are voluntary separations. (see light blue columns at bottom of graph for trend for "quits").
Job openings remain at a high level, and quits are still increasing year-over-year. This was a solid report.
Industrial Production Increased 0.1% in February
by Calculated Risk on 3/15/2019 09:21:00 AM
From the Fed: Industrial Production and Capacity Utilization
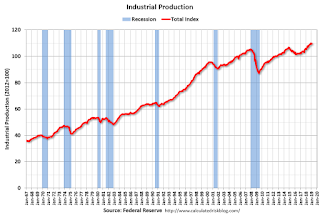
Industrial production edged up 0.1 percent in February after decreasing 0.4 percent in January. Manufacturing production fell 0.4 percent in February for its second consecutive monthly decline. The index for utilities rose 3.7 percent, while the index for mining moved up 0.3 percent. At 109.7 percent of its 2012 average, total industrial production was 3.5 percent higher in February than it was a year earlier. Capacity utilization for the industrial sector edged down 0.1 percentage point in February to 78.2 percent, a rate that is 1.6 percentage points below its long-run (1972–2018) average.
emphasis added
 Click on graph for larger image.
This graph shows Capacity Utilization. This series is up 11.5 percentage points from the record low set in June 2009 (the series starts in 1967).
Capacity utilization at 78.2% is 1.6% below the average from 1972 to 2017 and below the pre-recession level of 80.8% in December 2007.
Note: y-axis doesn't start at zero to better show the change.
 The second graph shows industrial production since 1967.
Industrial production increased in February to 109.7. This is 26% above the recession low, and 4.1% above the pre-recession peak.
The increase in industrial production and decrease in capacity utilization were below consensus.
NY Fed: Manufacturing "Business activity grew only slightly in New York State"
by Calculated Risk on 3/15/2019 08:45:00 AM
From the NY Fed: Empire State Manufacturing Survey
Manufacturing firms in New York State reported that business activity expanded only slightly. The general business conditions index fell five points to 3.7, its third consecutive monthly reading below 10, suggesting that growth has remained quite a bit slower so far this year than it was for most of 2018.This was below the consensus forecast.
The index for number of employees climbed ten points to 13.8, pointing to an increase in employment levels, though the average workweek index turned negative for the first time since 2016. emphasis added
Thursday, March 14, 2019
Friday: Industrial Production, Job Openings, NY Fed Mfg Survey
by Calculated Risk on 3/14/2019 06:27:00 PM
Friday:
• At 8:30 AM ET, The New York Fed Empire State manufacturing survey for March. The consensus is for a reading of 10.0, up from 8.8.
• At 9:15 AM, The Fed will release Industrial Production and Capacity Utilization for February. The consensus is for a 0.4% increase in Industrial Production, and for Capacity Utilization to increase to 78.5%.
• At 10:00 AM, University of Michigan's Consumer sentiment index (Preliminary for March).
• At 10:00 AM, Job Openings and Labor Turnover Survey for January from the BLS.
A few Comments on January New Home Sales
by Calculated Risk on 3/14/2019 03:34:00 PM
First, this report was for January; the February report will be released on March 29th.
New home sales for January were reported at 607,000 on a seasonally adjusted annual rate basis (SAAR). This was below the consensus forecast, however the three previous months were revised up.
With these revisions, sales increased 2.3% in 2018 compared to 2017. I expect sales to be around the same level in 2019 as in 2018 (not fall off a cliff), and my guess is we haven't seen the peak of this cycle yet.
On Inventory: Months of inventory is now above the top of the normal range, however the number of units completed and under construction is still somewhat low. Inventory will be something to watch very closely.
Earlier: New Home Sales decreased to 607,000 Annual Rate in January.

This graph shows new home sales for 2018 and 2019 by month (Seasonally Adjusted Annual Rate).
The comparison will be most difficult in Q1.
And here is another update to the "distressing gap" graph that I first started posting a number of years ago to show the emerging gap caused by distressed sales. Now I'm looking for the gap to close over the next several years.
 The "distressing gap" graph shows existing home sales (left axis) and new home sales (right axis) through January 2019. This graph starts in 1994, but the relationship had been fairly steady back to the '60s.
 Following the housing bubble and bust, the "distressing gap" appeared mostly because of distressed sales. The gap has persisted even though distressed sales are down significantly, since new home builders have focused on more expensive homes.
I still expect this gap to slowly close. However, this assumes that the builders will offer some smaller, less expensive homes. If not, then the gap will persist.
However, this assumes that the builders will offer some smaller, less expensive homes. If not, then the gap will persist.
xisting home sales are counted when transactions are closed, and new home sales are counted when contracts are signed. So the timing of sales is different.
New Home Sales decreased to 607,000 Annual Rate in January
by Calculated Risk on 3/14/2019 11:19:00 AM
Note: This release is for January (this was delayed due to the government shutdown). The February report is scheduled for March 29th.
The Census Bureau reports New Home Sales in January were at a seasonally adjusted annual rate (SAAR) of 607 thousand.
The previous three months were revised up significantly.
"Sales of new single‐family houses in January 2019 were at a seasonally adjusted annual rate of 607,000, according to estimates released jointly today by the U.S. Census Bureau and the Department of Housing and Urban Development. This is 6.9 percent below the revised December rate of 652,000 and is 4.1 percent below the January 2018 estimate of 633,000."
emphasis added
 Click on graph for larger image.
The first graph shows New Home Sales vs. recessions since 1963. The dashed line is the current sales rate.
Even with the increase in sales over the last several years, new home sales are still somewhat low historically.
The second graph shows New Home Months of Supply.
 The months of supply increased in January to 6.6 months from 6.3 months in December.
 The all time record was 12.1 months of supply in January 2009.
This is above the normal range (less than 6 months supply is normal).
"The seasonally‐adjusted estimate of new houses for sale at the end of January was 336,000. This represents a supply of 6.6 months at the current sales rate."
 On inventory, according to the Census Bureau:
 "A house is considered for sale when a permit to build has been issued in permit-issuing places or work has begun on the footings or foundation in nonpermit areas and a sales contract has not been signed nor a deposit accepted."Starting in 1973 the Census Bureau broke this down into three categories: Not Started, Under Construction, and Completed.
The third graph shows the three categories of inventory starting in 1973.
The inventory of completed homes for sale is still somewhat low, and the combined total of completed and under construction is a little low.
 The last graph shows sales NSA (monthly sales, not seasonally adjusted annual rate).
In January 2019 (red column), 45 thousand new homes were sold (NSA). Last year, 48 thousand homes were sold in January.
The all time high for January was 92 thousand in 2005, and the all time low for January was 21 thousand in 2011.
This was below expectations of 620,000 sales SAAR, however the three previous months were revised up significantly. I'll have more later today.
Weekly Initial Unemployment Claims increased to 229,000
by Calculated Risk on 3/14/2019 08:33:00 AM
The DOL reported:
In the week ending March 9, the advance figure for seasonally adjusted initial claims was 229,000, an increase of 6,000 from the previous week's unrevised level of 223,000. The 4-week moving average was 223,750, a decrease of 2,500 from the previous week's unrevised average of 226,250.The previous week was unrevised.
emphasis added
The following graph shows the 4-week moving average of weekly claims since 1971.
 Click on graph for larger image.
The dashed line on the graph is the current 4-week average. The four-week average of weekly unemployment claims decreased to 223,750.
This was slightly above to the consensus forecast.
Wednesday, March 13, 2019
Thursday: New Home Sales, Unemployment Claims
by Calculated Risk on 3/13/2019 06:56:00 PM
Note: Still catching up on New Home sales following the government shutdown. The report released tomorrow will be for January. The February new home sales report is scheduled for March 29th. The March report will be released on the normal schedule.
Thursday:
• At 8:30 AM, The initial weekly unemployment claims report will be released. The consensus is for 225 thousand initial claims, up from 223 thousand the previous week.
• At 10:00 AM, New Home Sales for January from the Census Bureau. The consensus is for 620 thousand SAAR, down from 621 thousand in December.
Houston Real Estate in February: Sales up Slightly YoY, Inventory Up 17%
by Calculated Risk on 3/13/2019 02:00:00 PM
From the HAR: Houston Home Rentals Soar in February While Sales Recover
After a generally mixed performance in January, the Houston housing market showed considerably more vitality in February, particularly among rental properties. Unlike January, which brought declining sales across all pricing segments, sales last month rose among homes priced between $150,000 and $750,000, with the high end of that range performing best. Inventory continued to grow, generating an improved supply of homes for consumers as the spring buying season gets underway.
According to the newest monthly report from the Houston Association of Realtors® (HAR), sales of single-family homes were statistically flat in February, with 5,280 homes sold compared to 5,265 a year earlier, marking the end of three straight months of declines.
...
Sales of all property types totaled 6,388, also statistically flat when compared to last February’s tally of 6,368. Total dollar volume for the month rose 3.1 percent to $1.76 billion.
“The Houston real estate market seems to be emerging from the winter doldrums with improvement in sales volume and an exceptionally strong performance among rental properties in February,” said HAR Chair Shannon Cobb Evans with Heritage Texas Properties. “This suggests that many consumers are opting to rent until they find the right home at the right price at the right interest rate to buy.”
...
Total active listings, or the total number of available properties, jumped 17.4 percent to 39,304.
Single-family homes months of inventory was at a 3.7-months supply, up from 3.1 months last February, but slightly below the national inventory level of 3.9 months ...
emphasis added
Mortgage Rates and Ten Year Yield
by Calculated Risk on 3/13/2019 11:46:00 AM
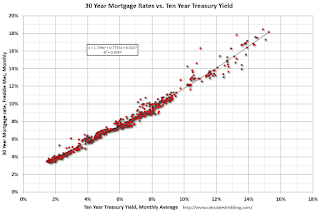
With the ten year yield falling to 2.6%, and based on an historical relationship, 30-year rates should currently be around 4.4%.
As of yesterday, Mortgage News Daily reported: Mortgage Rates Drop to New 14-Month Lows
Mortgage rates dropped convincingly today, bringing them to new long-term lows. The average lender hasn't offered anything lower for more than a year (January 2018). The improvement came on a combination of news headlines, economic data, and the scheduled sale of US 10yr Treasury debt. [30YR FIXED - 4.375% - 4.5%]The graph shows the relationship between the monthly 10 year Treasury Yield and 30 year mortgage rates from the Freddie Mac survey.
emphasis added
 Currently the 10 year Treasury yield is at 2.62%, and 30 year mortgage rates were at 4.41% according to the Freddie Mac survey last week.
To fall to 4% on the Freddie Mac survey, and based on the historical relationship, the Ten Year yield would have to fall to around 2.1%
To increase to 5% (on the Freddie Mac survey), based on the historical relationship, the Ten Year yield would have to increase to about 3.3%.


