by Calculated Risk on 1/08/2019 09:47:00 AM
Tuesday, January 08, 2019
Small Business Optimism Index decreased in December
CR Note: Most of this survey is noise, but there is some information, especially on the labor market and the "Single Most Important Problem".
From the National Federation of Independent Business (NFIB): December 2018 Report: Small Business Optimism Index
The Small Business Optimism Index was basically unchanged in December, drifting down 0.4 points to 104.4. Job openings set a new record high, job creation plans strengthened, and inventory investment plans surged. On the downside, expected real sales growth and expected business conditions in six months accounted for the decline in the Index.
..
Job creation was solid in December with a net addition of 0.25 workers per firm (including those making no change in employment), up from 0.19 in November and the best reading since July. ... Twenty-three percent of owners cited the difficulty of finding qualified workers as their Single Most Important Business Problem, down 2 points from last month’s record high reading. Thirty-nine percent of all owners reported job openings they could not fill in the current period, up 5 points and a new record high. Labor markets are still exceptionally tight.
emphasis added
 Click on graph for larger image.
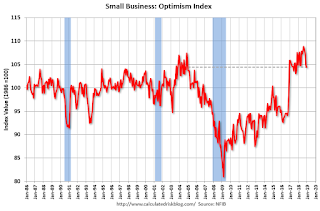
This graph shows the small business optimism index since 1986.
The index decreased to 104.4 in December.
Note: Usually small business owners complain about taxes and regulations (currently 2nd and 3rd on the "Single Most Important Problem" list). However, during the recession, "poor sales" was the top problem. Now the difficulty of finding qualified workers is the top problem.
Monday, January 07, 2019
Tuesday: Job Openings, Trade Deficit (Postponed)
by Calculated Risk on 1/07/2019 07:51:00 PM
From Matthew Graham at Mortgage News Daily: Mortgage Rates Continue Rising From Long-Term Lows
Mortgage rates were higher again today, extending a 2-day move from the lowest levels since early 2018. The size and pace of the late 2018 improvements introduced the risk of a bounce even before last Friday's key events. [30YR FIXED - 4.5%]Tuesday:
emphasis added
• At 6:00 AM: NFIB Small Business Optimism Index for December.
• At 8:30 AM: POSTPONED Trade Balance report for November from the Census Bureau. The consensus is the trade deficit to be $53.9 billion. The U.S. trade deficit was at $55.5 billion in October.
• At 10:00 AM ET: Job Openings and Labor Turnover Survey for November from the BLS.
• At 3:00 PM: Consumer Credit from the Federal Reserve.
Oil Rigs Declined, More Expected
by Calculated Risk on 1/07/2019 04:43:00 PM
A few comments from Steven Kopits of Princeton Energy Advisors LLC on January 4, 2019:
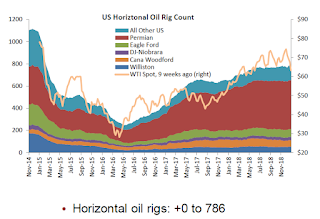
• Oil rigs fell, -8 to 877
• Notwithstanding, horizontal oil rigs held their ground, +0 to 786
• The Permian, interestingly enough, added one hz oil rig to a new high of 442
• Breakeven to add rigs fell to around $60 WTI compared to $47 WTI on the screen as of the writing of this report. To appearances, the operators stopped adding rigs on the way up at $65, and perhaps may not substantially cut rigs until oil fell below $65, which would imply cuts coming through next week.
• The model continues to predict big rig roll-offs in the next several weeks.
 Click on graph for larger image.
CR note: This graph shows the US horizontal rig count by basin.
Graph and comments Courtesy of Steven Kopits of Princeton Energy Advisors LLC.
Question #1 for 2019: Will Mr. Trump negatively impact the economy in 2019?
by Calculated Risk on 1/07/2019 02:18:00 PM
Earlier I posted some questions for this year: Ten Economic Questions for 2019. I've added some thoughts, and a few predictions for each question.
I do this every year to outline what I expect, and then - if the story changes - I can change my view. All of the previous questions were about key parts of the economy; economic growth, job growth, wages, and especially housing.
This last question is probably the key downside risk to the economy.
1) Administration Policy: These are dangerous times. When Mr. Trump was elected, I was not too concerned about the short term (Luckily the economy was in good shape, and the cupboard was full). But after almost two years of chaos - and the loss of some stabilizing cabinet officers - I'm more concerned. Will Mr. Trump negatively impact the economy in 2019?
To state the obvious: Mr. Trump is a thin-skinned narcissistic ignoramus. He tries to make everything about himself. He thinks he knows everything better than everyone else. He reacts viciously to the slightest criticism. And he stopped reading and studying decades ago. Not a good combination of traits.
So far Mr. Trump has had a limited negative impact on the economy. The tariffs are dumb, his immigration policy a negative, and the tax changes didn't deliver as promised. Fortunately the cupboard was full when Trump took office, and luckily there hasn't been a significant crisis.
This year is a little more scary. There are fewer sane voices in the administration to temper Mr. Trump's impulses. And Mr. Trump will likely find himself under even more intense scrutiny this year both from the new Congress, and the many investigations into Mr. Trump's activities.
How will he react to this increased pressure? What if there is a geopolitical or financial crisis? Will he keep the government shutdown for an extended period? Will he keep escalating the trade war?
These are all unknowns (although we know he would react poorly). My forecasts are based on a limited negative impact from Mr. Trump - and I hope that remains the case. But he is a key downside risk for the economy.
Here are the Ten Economic Questions for 2019 and a few predictions:
• Question #1 for 2019: Will Mr. Trump negatively impact the economy in 2019?
• Question #2 for 2019: How much will the economy grow in 2019?
• Question #3 for 2019: Will job creation in 2019 be as strong as in 2018?
• Question #3 for 2019: Will job creation in 2019 be as strong as in 2018?
• Question #4 for 2019: What will the unemployment rate be in December 2019?
• Question #5 for 2019: Will the core inflation rate rise in 2019? Will too much inflation be a concern in 2019?
• Question #6 for 2019: Will the Fed raise rates in 2019, and if so, by how much?
• Question #7 for 2019: How much will wages increase in 2019?
• Question #8 for 2019: How much will Residential Investment increase?
• Question #9 for 2019: What will happen with house prices in 2019?
• Question #10 for 2019: Will housing inventory increase or decrease in 2019?
Update: Framing Lumber Prices Down Year-over-year
by Calculated Risk on 1/07/2019 12:35:00 PM
Here is another monthly update on framing lumber prices. Lumber prices declined from the record highs in early 2018, and are now down about 25% year-over-year.
This graph shows two measures of lumber prices: 1) Framing Lumber from Random Lengths through December 14, 2018 (via NAHB), and 2) CME framing futures.

Right now Random Lengths prices are down 22% from a year ago, and CME futures are down 25% year-over-year.
There is a seasonal pattern for lumber prices. Prices frequently peak around May, and bottom around October or November - although there is quite a bit of seasonal variability.
ISM Non-Manufacturing Index decreased to 57.6% in December
by Calculated Risk on 1/07/2019 10:12:00 AM
The December ISM Non-manufacturing index was at 57.6%, down from 60.7% in November. The employment index decreased in November to 56.3%, from 58.4%. Note: Above 50 indicates expansion, below 50 contraction.
From the Institute for Supply Management: December 2018 Non-Manufacturing ISM Report On Business®
Economic activity in the non-manufacturing sector grew in December for the 107th consecutive month, say the nation’s purchasing and supply executives in the latest Non-Manufacturing ISM® Report On Business®.
The report was issued today by Anthony Nieves, CPSM, C.P.M., A.P.P., CFPM, Chair of the Institute for Supply Management® (ISM®) Non-Manufacturing Business Survey Committee: “The NMI® registered 57.6 percent, which is 3.1 percentage points lower than the November reading of 60.7 percent. This represents continued growth in the non-manufacturing sector, at a slower rate. The Non-Manufacturing Business Activity Index decreased to 59.9 percent, 5.3 percentage points lower than the November reading of 65.2 percent, reflecting growth for the 113th consecutive month, at a slower rate in December. The New Orders Index registered 62.7 percent, 0.2 percentage point higher than the reading of 62.5 percent in November. The Employment Index decreased 2.1 percentage points in December to 56.3 percent from the November reading of 58.4 percent. The Prices Index decreased 6.7 percentage points from the November reading of 64.3 percent to 57.6 percent, indicating that prices increased in December for the 34th consecutive month. According to the NMI®, 16 non-manufacturing industries reported growth. The non-manufacturing sector’s growth rate cooled off in December. Respondents indicate that there still is concern about tariffs, despite the hold on increases by the U.S. and China. Also, comments reflect that capacity constraints have lessened; however, employment-resource challenges remain. Respondents are mostly optimistic about overall business conditions.”
emphasis added
 Click on graph for larger image.
This graph shows the ISM non-manufacturing index (started in January 2008) and the ISM non-manufacturing employment diffusion index.
This suggests slower expansion in December than in November.
Sunday, January 06, 2019
Sunday Night Futures
by Calculated Risk on 1/06/2019 07:20:00 PM
Weekend:
• Schedule for Week of January 6, 2019
Monday:
• At 10:00 AM, the ISM non-Manufacturing Index for December. The consensus is for a decrease to 58.4 from 60.7.
From CNBC: Pre-Market Data and Bloomberg futures: S&P 500 are up 14 and DOW futures are up 150 (fair value).
Oil prices were up over the last week with WTI futures at $48.84 per barrel and Brent at $57.96 per barrel. A year ago, WTI was at $62, and Brent was at $68 - so oil prices are down about 20% year-over-year.
Here is a graph from Gasbuddy.com for nationwide gasoline prices. Nationally prices are at $2.22 per gallon. A year ago prices were at $2.48 per gallon, so gasoline prices are down 26 cents per gallon year-over-year.
The Impact of the Government Shutdown on the January Employment Report
by Calculated Risk on 1/06/2019 08:01:00 AM
If the government shutdown continues through this coming week, then the unemployment rate in the January report will be negatively impacted. This is a key week since it is the reference week for the BLS report (contains the 12th of the month). If the shutdown continues through next weekend, Federal employees who are on furlough will be counted as unemployed in the January report (CPS, Household survey).
However, the furloughed employees still have jobs, so their positions will still be counted in the CES (Establishment survey). So the headline employment number will not be directly impacted.
The closest example to the current situation is the October 2013 government shutdown that lasted from October 1st through October 17th (there are differences in what was shutdown). From the October 2013 employment report:
Among the unemployed, however, the number who reported being on temporary layoff increased by 448,000. This figure includes furloughed federal employees who were classified as unemployed on temporary layoff under the definitions used in the household survey.If the government shutdown continues, then the unemployment rate will probably bump up to 4.0% or 4.1% in the January report. Assuming the shutdown ends soon thereafter, the change in the unemployment rate will be reversed in the February report.
Update Jan 10, 2019: As far as the headline jobs number from the CES (Establishment survey), the jobs were people who are working without pay will still be counted. For the furloughed employees, it is different. Since they are not being paid, the positions will not be counted - UNLESS - legislation is passed that provides for back pay. If the legislation is passed, even after the reference week, the furloughed positions will be counted in the CES (headline jobs number). This is what has happened in previous shutdowns.
So, for the unemployment number, it depends on what happens this week.
For the headline jobs number, it depends on what legislation is eventually passed.
Saturday, January 05, 2019
Schedule for Week of January 6th
by Calculated Risk on 1/05/2019 08:11:00 AM
Special Note on Government Shutdown: If the Government shutdown continues, then some releases will be delayed. As an example, this week, the report on International Trade (trade deficit) will not be released if the government remains shutdown.
The key report this week is the December CPI report on Friday.
10:00 AM: the ISM non-Manufacturing Index for December. The consensus is for a decrease to 58.4 from 60.7.
6:00 AM: NFIB Small Business Optimism Index for December.
 8:30 AM: Trade Balance report for November from the Census Bureau.
 This graph shows the U.S. trade deficit, with and without petroleum, through the most recent report. The blue line is the total deficit, and the black line is the petroleum deficit, and the red line is the trade deficit ex-petroleum products.
The consensus is the trade deficit to be $53.9 billion. The U.S. trade deficit was at $55.5 billion in October.
 10:00 AM ET: Job Openings and Labor Turnover Survey for November from the BLS.
 This graph shows job openings (yellow line), hires (purple), Layoff, Discharges and other (red column), and Quits (light blue column) from the JOLTS.
Jobs openings increased in October to 7.079 million from 6.960 million in September.
The number of job openings (yellow) were up 17% year-over-year, and Quits were up 9% year-over-year.
3:00 PM: Consumer Credit from the Federal Reserve.
7:00 AM ET: The Mortgage Bankers Association (MBA) will release the results for the mortgage purchase applications index.
2:00 PM: FOMC Minutes, Meeting of Dec 18-19
8:30 AM: The initial weekly unemployment claims report will be released. The consensus is for 222 thousand initial claims, down from 231 thousand the previous week.
8:30 AM: The Producer Price Index for December from the BLS.
12:45 PM: Discussion, Fed Chair Jerome Powell, At the Economic Club of Washington, D.C., Washington, D.C.
8:30 AM: The Consumer Price Index for November from the BLS. The consensus is for 0.1% decrease in CPI, and a 0.2% increase in core CPI.
New Home Sales (Census) for November from the Census Bureau. The consensus was for 560 thousand SAAR, up from 544 thousand in October.
Construction Spending (Census) for November. The consensus was for a 0.3% increase in construction spending.
Light vehicle sales (BEA) for December. The consensus was for light vehicle sales to be 17.2 million SAAR in December, down from 17.4 million in November (Seasonally Adjusted Annual Rate).
Friday, January 04, 2019
AAR: December Rail Carloads up 2.9% YoY, Intermodal Up 5.0% YoY
by Calculated Risk on 1/04/2019 06:11:00 PM
From the Association of American Railroads (AAR) Rail Time Indicators. Graphs and excerpts reprinted with permission.
U.S. freight rail traffic in December and the full year 2018 was mixed, but for the most part was positive. Intermodal finished the year strong, rising 5.0% in December 2018. The first and second weeks of December (weeks 49 and 50 of the year) were the two highest-volume intermodal months in history, exceeding 300,000 units in a single week for the first time. Intermodal set a new annual record in 2018: total volume was 14.47 million containers and trailers, up 5.5%, or 751,217 units, over 2017. Total carloads, meanwhile, rose 2.9% in December 2018 over December 2017, their 9th year-over-year increase in 2018. For the full year, total carloads were up 1.8%, or 238,857 carloads.
emphasis added
 Click on graph for larger image.
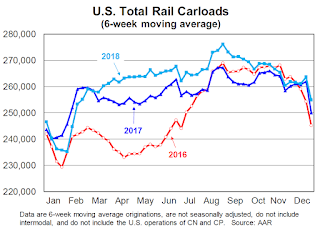
This graph from the Rail Time Indicators report shows U.S. average weekly rail carloads (NSA). Light blue is 2018.
Rail carloads have been weak over the last decade due to the decline in coal shipments.
U.S. railroads (excluding the U.S. operations of Canadian railroads) originated 1.022 million carloads in December 2018, up 2.9%, or 29,139 carloads, over December 2017. December was the ninth yearover- year monthly increase for total carloads in 2018 and reversed a slight decline in November. Total carloads averaged 255,495 per week in December 2018, the most for December since 2014.
 The second graph is for intermodal traffic (using intermodal or shipping containers):
U.S. railroads originated 1.10 million containers and trailers in December 2018, up 5.0% over December 2017. Weekly average intermodal volume in December 2018 was 274,029, easily the highest weekly average for December for intermodal in history. In fact, the first and second weeks of December 2018 (weeks 49 and 50 of the year) were the highest volume intermodal weeks in history for U.S. railroads, regardless of month, with 303,225 and 301,407 intermodal units originated, respectively. That’s the first time ever that intermodal originations exceeded 300,000 in a single week. So much for intermodal peaking in September or October. The top 10 intermodal weeks in history were all in 2018, as were nine of the top ten intermodal months2018 was another record year for intermodal traffic.


