 RSS Feed
 by Calculated Risk on 6/06/2018 09:18:00 AM
Wednesday, June 06, 2018
Trade Deficit decreased to $46.2 Billion in April
From the Department of Commerce reported:
The U.S. Census Bureau and the U.S. Bureau of Economic Analysis announced today that the goods and services deficit was $46.2 billion in April, down $1.0 billion from $47.2 billion in March, revised. … April exports were $211.2 billion, $0.6 billion more than March exports. April imports were $257.4 billion, $0.4 billion less than March imports.
 Click on graph for larger image.
Exports increased and imports decreased in April.
Exports are 28% above the pre-recession peak and up 10% compared to April 2017; imports are 11% above the pre-recession peak, and up 8% compared to April 2017.
In general, trade has been picking up.
The second graph shows the U.S. trade deficit, with and without petroleum.
 The blue line is the total deficit, and the black line is the petroleum deficit, and the red line is the trade deficit ex-petroleum products.
Oil imports averaged $54.00 in April, up slightly from $54.50 in March, and up from $45.40 in April 2017.
The trade deficit with China increased to $28.0 billion in April, from $27.7 billion in April 2017.
MBA: Mortgage Applications Increase in Latest Weekly Survey
by Calculated Risk on 6/06/2018 07:00:00 AM
From the MBA: Mortgage Applications Increase in Latest MBA Weekly Survey
Mortgage applications increased 4.1 percent from one week earlier, according to data from the Mortgage Bankers Association’s (MBA) Weekly Mortgage Applications Survey for the week ending June 1, 2018. This week’s results included an adjustment for the Memorial Day holiday.
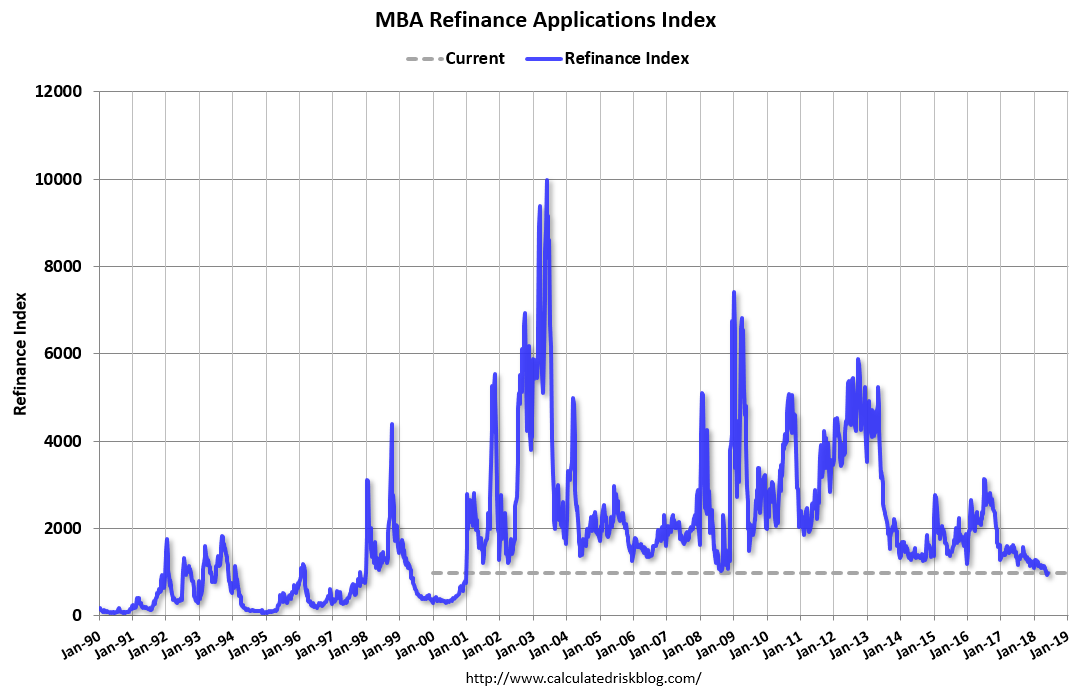
... The Refinance Index increased 4 percent from the previous week. The seasonally adjusted Purchase Index increased 4 percent from one week earlier. The unadjusted Purchase Index decreased 8 percent compared with the previous week and was 9 percent higher than the same week one year ago. ...
The average contract interest rate for 30-year fixed-rate mortgages with conforming loan balances ($453,100 or less) decreased to 4.75 percent from 4.84 percent, with points decreasing to 0.46 from 0.47 (including the origination fee) for 80 percent loan-to-value ratio (LTV) loans.
emphasis added
 Click on graph for larger image.
The first graph shows the refinance index since 1990.
Refinance activity will not pick up significantly unless mortgage rates fall 50 bps or more from the recent level.
 The second graph shows the MBA mortgage purchase index
 According to the MBA, purchase activity is up 9% year-over-year.
Tuesday, June 05, 2018
Wednesday: Trade Deficit
by Calculated Risk on 6/05/2018 07:25:00 PM
Wednesday:
• At 7:00 AM ET, The Mortgage Bankers Association (MBA) will release the results for the mortgage purchase applications index.
• At 8:30 AM, Trade Balance report for April from the Census Bureau. The consensus is for the U.S. trade deficit to be at $49.0 billion in April unchanged from $49.0 billion in March.
CoreLogic: Underwriting Loosening for Conventional Conforming Loans
by Calculated Risk on 6/05/2018 05:01:00 PM
Some interesting data and analysis from Archana Pradhan at CoreLogic: Underwriting Loosening for Conventional Conforming Loans
Mortgage underwriting guidelines have loosened in the last couple of years. To expand the credit box to creditworthy borrowers, Fannie Mae began accepting mortgages with loan-to-value (LTV) ratios up to 97 percent in December 2014 and Freddie Mac in March 2015. To further expand access to credit, Fannie Mae raised its DTI ratio level from 45 to 50 percent in July 2017. DTI and LTV ratios along with the credit scores are three important factors in mortgage underwriting. This blog focuses on only conventional conforming (CC) home-purchase loans, which is a majority of the U.S. mortgage market.
…
Though both DTI and LTV standards have been relaxed, there has been no change in credit score standards. Holding steady at 755, the average credit scores for the homebuyers with CC home-purchase loans in Q1 2018 was unchanged from Q1 2017. However, the average credit score was much higher than the pre-crises level. For example, the average credit score of homebuyers was 705 in 2001, but dramatically rose during the Great Recession and was 755 in Q1 2018. In addition to high credit score standards, those high LTV/DTI loans in Q1 2018 were fully documented and are thus different than the pre-crash high LTV/DTI loans, many of which were low- or no-doc loans.
…
This data indicated that underwriting continues to be cautious but loosening slightly for conventional conforming home-purchase loans during the Q1 2018 than a year earlier and in early 2000s.
ISM Non-Manufacturing Index increased to 58.6% in May
by Calculated Risk on 6/05/2018 12:08:00 PM
The May ISM Non-manufacturing index was at 58.6%, up from 56.8% in April. The employment index increased in May to 54.1%, from 53.6%. Note: Above 50 indicates expansion, below 50 contraction.
From the Institute for Supply Management: May 2018 Non-Manufacturing ISM Report On Business®
Economic activity in the non-manufacturing sector grew in May for the 100th consecutive month, say the nation’s purchasing and supply executives in the latest Non-Manufacturing ISM® Report On Business®.
The report was issued today by Anthony Nieves, CPSM, C.P.M., A.P.P., CFPM, Chair of the Institute for Supply Management® (ISM®) Non-Manufacturing Business Survey Committee: “The NMI® registered 58.6 percent, which is 1.8 percentage points higher than the April reading of 56.8 percent. This represents continued growth in the non-manufacturing sector at a faster rate. The Non-Manufacturing Business Activity Index increased to 61.3 percent, 2.2 percentage points higher than the April reading of 59.1 percent, reflecting growth for the 106th consecutive month, at a faster rate in May. The New Orders Index registered 60.5 percent, 0.5 percentage point higher than the reading of 60 percent in April. The Employment Index increased 0.5 percentage point in May to 54.1 percent from the April reading of 53.6 percent. The Prices Index increased by 2.5 percentage points from the April reading of 61.8 percent to 64.3 percent, indicating that prices increased in May for the 27th consecutive month. According to the NMI®, 14 non-manufacturing industries reported growth. The majority of respondents are optimistic about business conditions and the overall economy. There continue to be concerns about the uncertainty surrounding tariffs, trade agreements and the impact on cost of goods sold.”
emphasis added
 Click on graph for larger image.
This graph shows the ISM non-manufacturing index (started in January 2008) and the ISM non-manufacturing employment diffusion index.
This suggests faster expansion in May than in April.
BLS: Job Openings Increased in April to New Series High
by Calculated Risk on 6/05/2018 10:07:00 AM
A milestone: In April there were 6.698 million job openings, and, according to the April Employment report, there were 6.346 million unemployed. So there are now more job openings than unemployed. Also note that the number of job openings has exceeded the number of hires since January 2015.
From the BLS: Job Openings and Labor Turnover Summary
The number of job openings was little changed at 6.7 million on the last business day of April, the U.S. Bureau of Labor Statistics reported today. Over the month, hires and separations were little changed at 5.6 million and 5.4 million, respectively. Within separations, the quits rate was unchanged at 2.3 percent and the layoffs and discharges rate increased to 1.2 percent. ...The following graph shows job openings (yellow line), hires (dark blue), Layoff, Discharges and other (red column), and Quits (light blue column) from the JOLTS.
The number of quits was little changed at 3.4 million in April. The quits rate was 2.3 percent. The number of quits was little changed for total private and increased for government (+17,000). Quits increased in state and local government education (+14,000) but decreased in arts, entertainment, and recreation (-25,000).
emphasis added
This series started in December 2000.
Note: The difference between JOLTS hires and separations is similar to the CES (payroll survey) net jobs headline numbers. This report is for April, the most recent employment report was for May.
 Click on graph for larger image.
Note that hires (dark blue) and total separations (red and light blue columns stacked) are pretty close each month. This is a measure of labor market turnover. When the blue line is above the two stacked columns, the economy is adding net jobs - when it is below the columns, the economy is losing jobs.
Jobs openings increased in April to 6.698 million from 6.633 million in March.
The number of job openings (yellow) are up 9.7% year-over-year.
Quits are up 9.1% year-over-year. These are voluntary separations. (see light blue columns at bottom of graph for trend for "quits").
Job openings are at the highest level since this series started, and quits are increasing year-over-year. This was a strong report.
CoreLogic: House Prices up 6.9% Year-over-year in April
by Calculated Risk on 6/05/2018 08:00:00 AM
Notes: This CoreLogic House Price Index report is for April. The recent Case-Shiller index release was for March. The CoreLogic HPI is a three month weighted average and is not seasonally adjusted (NSA).
From CoreLogic: CoreLogic Reports April Home Prices Up, Washington State Increased 12.8 Percent
CoreLogic® ... today released the CoreLogic Home Price Index (HPI™) and HPI Forecast™ for April 2018, which shows home prices rose both year over year and month over month. Home prices increased nationally by 6.9 percent year over year from April 2017 to April 2018. On a month-over-month basis, prices increased by 1.2 percent in April 2018 – compared with March 2018 – according to the CoreLogic HPI.CR Note: The CoreLogic YoY increase has been in the 5% to 7% range for the last couple of years. This is towards the top end of that range. The year-over-year comparison has been positive for over six consecutive years since turning positive year-over-year in February 2012.
Looking ahead, the CoreLogic HPI Forecast indicates that the national home-price index is projected to continue to increase by 5.3 percent on a year-over-year basis from April 2018 to April 2019. On a month-over-month basis, home prices are expected to rise 0.2 percent in May 2018. The CoreLogic HPI Forecast is a projection of home prices that is calculated using the CoreLogic HPI and other economic variables. Values are derived from state-level forecasts by weighting indices according to the number of owner-occupied households for each state.
“The best antidote for rising home prices is additional supply,” said Dr. Frank Nothaft, chief economist for CoreLogic. “New construction has failed to keep up with and meet new housing growth or replace existing inventory. More construction of for-sale and rental housing will alleviate housing cost pressures.”
emphasis added
Monday, June 04, 2018
Tuesday: Job Openings, ISM non-Mfg Survey
by Calculated Risk on 6/04/2018 08:05:00 PM
From Matthew Graham at Mortgage News Daily: Mortgage Rates Continue Higher
Mortgage rates continued higher, adding onto a trend that began last Wednesday. A day earlier, rates hit their best levels in more than a month due to political risks in Europe. The trend back toward higher rates has coincided with the defusing of those risks. [30YR FIXED - 4.625%-4.75%]Tuesday:
emphasis added
• At 8:00 AM ET, Corelogic House Price index for April.
• At 10:00 AM, Job Openings and Labor Turnover Survey for April from the BLS.
• Also at 10:00 AM, the ISM non-Manufacturing Index for May. The consensus is for index to increase to 58.0 from 56.8 in April.
Annual Vehicle Sales: On Pace to decline slightly in 2018
by Calculated Risk on 6/04/2018 04:09:00 PM
The BEA released their estimate of May vehicle sales this morning. The BEA estimated sales of 16.81 million SAAR in May 2018 (Seasonally Adjusted Annual Rate), down 1.8% from the April sales rate, and up slightly from May 2017.
Through May, light vehicle sales are on pace to be down slightly in 2018 compared to 2017.
This would make 2018 the sixth best year on record after 2016, 2015, 2000, 2017 and 2001.
My guess is vehicle sales will finish the year with sales lower than in 2017. A small decline in sales this year isn't a concern - I think sales will move mostly sideways at near record levels.
As I noted last year, this means the economic boost from increasing auto sales is over (from the bottom in 2009, auto sales boosted growth every year through 2016).

Click on graph for larger image.
This graph shows annual light vehicle sales since 1976. Source: BEA.
Sales for 2018 are estimated based on the pace of sales during the first five months.
Update: Framing Lumber Prices Up Sharply Year-over-year, At Record Prices
by Calculated Risk on 6/04/2018 02:04:00 PM
Here is another monthly update on framing lumber prices. Early in 2013 lumber prices came close to the housing bubble highs - and now prices are well above the bubble highs.
This graph shows two measures of lumber prices: 1) Framing Lumber from Random Lengths through May 2018 (via NAHB), and 2) CME framing futures.
 Click on graph for larger image in graph gallery.
Right now Random Lengths prices are up 42% from a year ago, and CME futures are up about 70% year-over-year.
There is a seasonal pattern for lumber prices. Prices frequently peak around May, and bottom around October or November - although there is quite a bit of seasonal variability.
Rising costs - both material and labor - will be headwinds for the building industry this year.


