 RSS Feed
 by Calculated Risk on 3/22/2018 01:45:00 PM
Thursday, March 22, 2018
Housing Inventory Tracking
Update: Watching existing home "for sale" inventory is very helpful. As an example, the increase in inventory in late 2005 helped me call the top for housing.
And the decrease in inventory eventually helped me correctly call the bottom for house prices in early 2012, see: The Housing Bottom is Here.
And in 2015, it appeared the inventory build in several markets was ending, and that boosted price increases.
I don't have a crystal ball, but watching inventory helps understand the housing market.
The graph below shows the year-over-year change for non-contingent inventory in Las Vegas, Phoenix and Sacramento, and also total existing home inventory as reported by the NAR (all through February 2018).
 Click on graph for larger image.
This shows the year-over-year change in inventory for Phoenix, Sacramento, and Las Vegas. The black line if the year-over-year change in inventory as reported by the NAR.
Note that inventory is Sacramento was up 17% year-over-year in February (still very low), and has increased year-over-year for five consecutive months. However inventory is down Nationally, and down in Phoenix and Las Vegas.
I'll try to add a few other markets.
Inventory is a key for the housing market, and I will be watching inventory for the impact of the new tax law and higher mortgage rates on housing.
Kansas City Fed: Regional Manufacturing Activity "Continued at a Solid Pace" in March
by Calculated Risk on 3/22/2018 11:00:00 AM
From the Kansas City Fed: Tenth District Manufacturing Activity Continued at a Solid Pace
The Federal Reserve Bank of Kansas City released the March Manufacturing Survey today. According to Chad Wilkerson, vice president and economist at the Federal Reserve Bank of Kansas City, the survey revealed that Tenth District manufacturing activity continued at a solid pace, and optimism remained high for future activity.So far all of the regional Fed surveys have been solid in March.
“Factory activity continued to grow steadily in March,” said Wilkerson. “Firms continued to report high input and selling prices and many are concerned about higher steel and aluminum tariffs.”
...
The month-over-month composite index was 17 in March, equal to 17 in February and higher than 16 in January. The composite index is an average of the production, new orders, employment, supplier delivery time, and raw materials inventory indexes. Factory activity grew modestly at durable goods plants, particularly for machinery and aircraft, while production of nondurable goods moderated slightly. Month-over-month indexes were mixed. The shipments and new orders indexes decreased moderately, while the production, order backlog, and new orders for exports indexes where basically unchanged. In contrast, the employment index edged up from 23 to 26 and the supplier delivery time index jumped from 16 to 30, both at their highest levels in survey history. The raw materials inventory index increased from 8 to 11, and the finished goods inventory index also rose modestly.
emphasis added
Weekly Initial Unemployment Claims increase to 229,000
by Calculated Risk on 3/22/2018 08:34:00 AM
The DOL reported:
In the week ending March 17, the advance figure for seasonally adjusted initial claims was 229,000, an increase of 3,000 from the previous week's unrevised level of 226,000. The 4-week moving average was 223,750, an increase of 2,250 from the previous week's unrevised average of 221,500.The previous week was unrevised.
Claims taking procedures in Puerto Rico and in the Virgin Islands have still not returned to normal.
emphasis added
The following graph shows the 4-week moving average of weekly claims since 1971.
 Click on graph for larger image.
The dashed line on the graph is the current 4-week average. The four-week average of weekly unemployment claims increased to 223,750.
This was slightly higher than the consensus forecast. The low level of claims suggest relatively few layoffs.
Wednesday, March 21, 2018
Thursday: Unemployment Claims
by Calculated Risk on 3/21/2018 07:29:00 PM
From Matthew Graham at Mortgage News Daily: Mortgage Rates Higher, Then Lower After Fed Announcement
Mortgage rates rose to new 4-year highs this morning as lenders took a defensive stance ahead of the afternoon's Fed Announcement. The caution proved to be warranted, at least at first, as bond markets reacted negatively to the first phase of Fed-related information. ... When new Fed Chair Jerome Powell began his press conference half an hour later, bond markets (which underlie rates) began to improve. Just over an hour after the initial drama, bonds moved into moderately positive territory on the day and most lenders offered positively-revised rate sheets (i.e. stronger bond markets allowed mortgage lenders to drop their rates). After those reprices, the average lender returned in line with yesterday's rates (which are still pretty close to 4-year highs, but a welcome sight after this morning's offerings). [30YR FIXED - 4.5-4.625%]Thursday:
emphasis added
• At 8:30 AM ET, The initial weekly unemployment claims report will be released. The consensus is for 225 thousand initial claims, up from 226 thousand the previous week.
• At 9:00 AM, FHFA House Price Index for January 2018. This was originally a GSE only repeat sales, however there is also an expanded index.
• At 11:00 AM, the Kansas City Fed manufacturing survey for March.
A Few Comments on February Existing Home Sales
by Calculated Risk on 3/21/2018 03:46:00 PM
Earlier: NAR: "Existing-Home Sales Rebound 3.0 Percent in February"
A few key points:
1) As usual, housing economist Tom Lawler's forecast was closer to the NAR report than the consensus (although only slightly closer this month). See: Lawler: Early Read on Existing Home Sales in January.
2) Inventory is still very low and falling year-over-year (down 8.1% year-over-year in February). More inventory would probably mean smaller price increases, and less inventory somewhat larger price increases. This was the 33rd consecutive month with a year-over-year decline in inventory.
The following graph shows existing home sales Not Seasonally Adjusted (NSA).
 Click on graph for larger image.
Sales NSA in February (319,000, red column) were above sales in February 2017 (315,000, NSA).
Sales NSA are always low in January and February, and we will have to wait until March - at the earliest - to draw any conclusions about the impact of higher interest rates and the new tax law on home sales.
FOMC Statement: 25bps Rate Hike
by Calculated Risk on 3/21/2018 02:01:00 PM
Powell press conference video here.
Here are the updated projections. Forecasting more rate hikes in 2019.
FOMC Statement:
Information received since the Federal Open Market Committee met in January indicates that the labor market has continued to strengthen and that economic activity has been rising at a moderate rate. Job gains have been strong in recent months, and the unemployment rate has stayed low. Recent data suggest that growth rates of household spending and business fixed investment have moderated from their strong fourth-quarter readings. On a 12-month basis, both overall inflation and inflation for items other than food and energy have continued to run below 2 percent. Market-based measures of inflation compensation have increased in recent months but remain low; survey-based measures of longer-term inflation expectations are little changed, on balance.
Consistent with its statutory mandate, the Committee seeks to foster maximum employment and price stability. The economic outlook has strengthened in recent months. The Committee expects that, with further gradual adjustments in the stance of monetary policy, economic activity will expand at a moderate pace in the medium term and labor market conditions will remain strong. Inflation on a 12-month basis is expected to move up in coming months and to stabilize around the Committee's 2 percent objective over the medium term. Near-term risks to the economic outlook appear roughly balanced, but the Committee is monitoring inflation developments closely. In view of realized and expected labor market conditions and inflation, the Committee decided to raise the target range for the federal funds rate to 1-1/2 to 1-3/4 percent. The stance of monetary policy remains accommodative, thereby supporting strong labor market conditions and a sustained return to 2 percent inflation.
In determining the timing and size of future adjustments to the target range for the federal funds rate, the Committee will assess realized and expected economic conditions relative to its objectives of maximum employment and 2 percent inflation. This assessment will take into account a wide range of information, including measures of labor market conditions, indicators of inflation pressures and inflation expectations, and readings on financial and international developments. The Committee will carefully monitor actual and expected inflation developments relative to its symmetric inflation goal. The Committee expects that economic conditions will evolve in a manner that will warrant further gradual increases in the federal funds rate; the federal funds rate is likely to remain, for some time, below levels that are expected to prevail in the longer run. However, the actual path of the federal funds rate will depend on the economic outlook as informed by incoming data.
Voting for the FOMC monetary policy action were Jerome H. Powell, Chairman; William C. Dudley, Vice Chairman; Thomas I. Barkin; Raphael W. Bostic; Lael Brainard; Loretta J. Mester; Randal K. Quarles; and John C. Williams. emphasis added
AIA: "Architecture billings continue to hold positive in 2018"
by Calculated Risk on 3/21/2018 11:33:00 AM
Note: This index is a leading indicator primarily for new Commercial Real Estate (CRE) investment.
From the AIA: Architecture billings continue to hold positive in 2018
The American Institute of Architects (AIA) is reporting an increase in architecture firm billings for February from its Architecture Billings Index (ABI), with several key segments showing an encouraging outlook for 2018.
“We remain optimistic about the trends we’re seeing at architecture firms this year with the ABI continuing to show growth in February,” said AIA Chief Economist, Kermit Baker, Hon. AIA, PhD. “We saw several major bright spots reflected in February’s data, as billings remained particularly strong at firms located in the West and Midwest.”
While the pace of growth in design activity slowed a bit in February for an ABI score of 52.0 (any score over 50 indicates billings growth), it still reflects a healthy business environment. In particular, firms with a multifamily residential or an institutional specialization continued to report extremely strong billings.
...
• Regional averages: West (57.6), Midwest (54.5), South (54.4), Northeast (47.5)
• Sector index breakdown: multi-family residential (56.6), institutional (53.8), commercial/industrial (51.0), mixed practice (49.7)
emphasis added
 Click on graph for larger image.
This graph shows the Architecture Billings Index since 1996. The index was at 52.0 in February, down from 54.7 in January. Anything above 50 indicates expansion in demand for architects' services.
Note: This includes commercial and industrial facilities like hotels and office buildings, multi-family residential, as well as schools, hospitals and other institutions.
According to the AIA, there is an "approximate nine to twelve month lag time between architecture billings and construction spending" on non-residential construction. This index was positive in 11 of the last 12 months, suggesting a further increase in CRE investment in 2018.
NAR: "Existing-Home Sales Rebound 3.0 Percent in February"
by Calculated Risk on 3/21/2018 10:12:00 AM
From the NAR: Existing-Home Sales Rebound 3.0 Percent in February
Despite consistently low inventory levels and faster price growth, existing-home sales bounced back in February after two straight months of declines, according to the National Association of Realtors®. Sizeable sales increases in the South and West offset declines in the Northeast and Midwest.
Total existing-home sales, which are completed transactions that include single-family homes, townhomes, condominiums and co-ops, grew 3.0 percent to a seasonally adjusted annual rate of 5.54 million in February from 5.38 million in January. After last month’s increase, sales are now 1.1 percent above a year ago.
...
Total housing inventory at the end of February rose 4.6 percent to 1.59 million existing homes available for sale, but is still 8.1 percent lower than a year ago (1.73 million) and has fallen year-over-year for 33 consecutive months. Unsold inventory is at a 3.4-month supply at the current sales pace (3.8 months a year ago).
emphasis added
 Click on graph for larger image.
This graph shows existing home sales, on a Seasonally Adjusted Annual Rate (SAAR) basis since 1993.
Sales in January (5.54 million SAAR) were 3.0% higher than last month, and were 1.1% above the February 2017 rate.
The second graph shows nationwide inventory for existing homes.
 According to the NAR, inventory increased to 1.59 million in February from 1.52 million in January. Headline inventory is not seasonally adjusted, and inventory usually decreases to the seasonal lows in December and January, and peaks in mid-to-late summer.
The last graph shows the year-over-year (YoY) change in reported existing home inventory and months-of-supply. Since inventory is not seasonally adjusted, it really helps to look at the YoY change. Note: Months-of-supply is based on the seasonally adjusted sales and not seasonally adjusted inventory.
 Inventory decreased 8.1% year-over-year in February compared to February 2017.
 Months of supply was at 3.4 months in February.
Sales were above the consensus view. For existing home sales, a key number is inventory - and inventory is still low. I'll have more later ...
MBA: Purchase Mortgage Applications Decrease in Latest Weekly Survey
by Calculated Risk on 3/21/2018 07:00:00 AM
From the MBA: Mortgage Applications Decrease in Latest MBA Weekly Survey
Mortgage applications decreased 1.1 percent from one week earlier, according to data from the Mortgage Bankers Association’s (MBA) Weekly Mortgage Applications Survey for the week ending March 16, 2018.
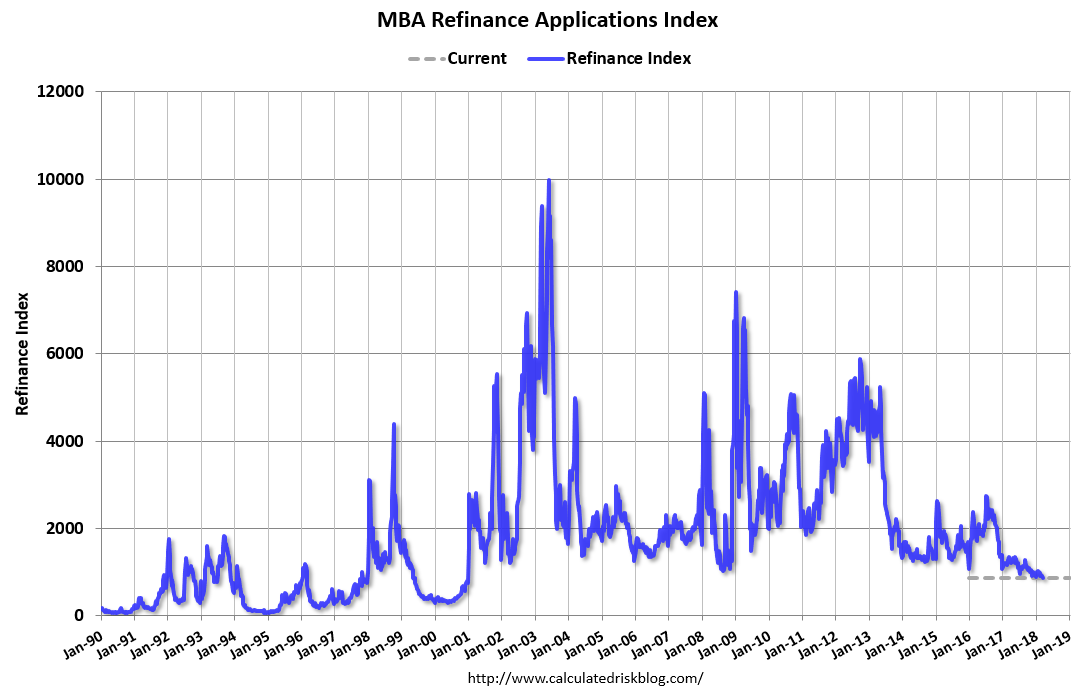
... The Refinance Index decreased 5 percent from the previous week. The seasonally adjusted Purchase Index increased 1 percent from one week earlier. The unadjusted Purchase Index increased 2 percent compared with the previous week and was 6 percent higher than the same week one year ago. ...
The average contract interest rate for 30-year fixed-rate mortgages with conforming loan balances ($453,100 or less) decreased to 4.68 percent from 4.69 percent, with points increasing to 0.46 from 0.45 (including the origination fee) for 80 percent loan-to-value ratio (LTV) loans.
emphasis added
 Click on graph for larger image.
The first graph shows the refinance index since 1990.
Refinance activity will not pick up significantly unless mortgage rates fall 50 bps or more from the recent level.
 The second graph shows the MBA mortgage purchase index
 According to the MBA, purchase activity is up 6% year-over-year.
Tuesday, March 20, 2018
Wednesday: FOMC Announcement, Existing Home Sales
by Calculated Risk on 3/20/2018 06:36:00 PM
Here is my FOMC preview and a preview from Goldman Sachs economists.
Wednesday:
• At 7:00 AM ET, The Mortgage Bankers Association (MBA) will release the results for the mortgage purchase applications index.
• At 10:00 AM, Existing Home Sales for February from the National Association of Realtors (NAR). The consensus is for 5.42 million SAAR, up from 5.38 million in January. Housing economist Tom Lawler expects the NAR to report sales of 5.44 million SAAR for February.
• During the day, The AIA's Architecture Billings Index for February (a leading indicator for commercial real estate).
• At 2:00 PM, FOMC Meeting Announcement. The FOMC is expected to increase the Fed Funds rate 25 bps at this meeting.
• At 2:00 PM, FOMC Forecasts This will include the Federal Open Market Committee (FOMC) participants' projections of the appropriate target federal funds rate along with the quarterly economic projections.
• At 2:30 PM, Fed Chair Jerome Powell holds a press briefing following the FOMC announcement.


