 RSS Feed
 by Calculated Risk on 3/19/2018 06:26:00 PM
Monday, March 19, 2018
"Mortgage Rates Maintain Flat Trajectory Ahead of Fed"
From Matthew Graham at Mortgage News Daily: Mortgage Rates Maintain Flat Trajectory Ahead of Fed
Mortgage rates have been on a tear recently, moving sideways with reckless abandon. Since the middle of February, the "effective rate" (based on actual rate sheet offerings and upfront costs) has held inside a narrow range of 4.52% and 4.58%. This lies in stark contrast to the persistent move higher during the first month and a half of 2018 which saw the same effective rate rise from roughly 4.0% into the 4.5% range.Here is a table from Mortgage News Daily:
When rates are as flat as they are on the approach to a key market event like this Wednesday's Fed announcement. We often see a break in that narrow range after the key event. [30YR FIXED - 4.5-4.625%]
emphasis added
Lawler: Early Read on Existing Home Sales in February
by Calculated Risk on 3/19/2018 03:19:00 PM
From housing economist Tom Lawler: Early Read on Existing Home Sales in February
Based on publicly-available local realtor/MLS reports from across the country released through today, I project that existing home sales as estimated by the National Association of Realtors ran at a seasonally adjusted annual rate of 5.44 million in February, up 1.1% from January’s preliminary pace and down 0.5% from last February’s seasonally adjusted pace.
On the inventory front, realtor/MLS data suggest that home listings showed a similar YOY decline last month compared to January, and my “best guess” is that the NAR’s estimate of the inventory of existing homes for sale in January will be 1.57 million, up 3.3% from January’s preliminary estimate and down 9.2% from last February.
Finally, local realtor/MLS data would be consistent with a YOY increase in the NAR’s estimate of the median existing SF home sales price of about 7.5%. I should note that lately the NAR’s estimated YOY gain in median existing SF home sale prices has been south of what local realtor data would have suggested, though I do not know why.
CR Note: Existing home sales for February are scheduled to be released by the NAR on Wednesday. The consensus is for 5.42 million SAAR, up from 5.38 million in January.
Q1 GDP Forecasts
by Calculated Risk on 3/19/2018 11:35:00 AM
Here are few Q1 GDP forecast.
From Merrill Lynch:
We continue to track 1.7% qoq saar for 1Q GDP [March 19 estimate].And from the Altanta Fed: GDPNow
The GDPNow model estimate for real GDP growth (seasonally adjusted annual rate) in the first quarter of 2018 is 1.8 percent on March 16, down from 1.9 percent on March 14.From the NY Fed Nowcasting Report
The New York Fed Staff Nowcast stands at 2.7% for 2018:Q1 and 2.8% for 2018:Q2. [March 16 estimate]CR Note: It looks like another weak Q1, and there might still be some residual seasonality in the first quarter.
FOMC Preview
by Calculated Risk on 3/19/2018 08:31:00 AM
The consensus is that the Fed will increase the Fed Funds Rate 25bps at the meeting this week, and the tone might be a bit more "hawkish".
Assuming the expected happens, the focus will be on the wording of the statement, the projections, and Fed Chair Jerome Powell's first press conference to try to determine how many rate hikes to expect in 2018 and in 2019.
Here are the December FOMC projections.
Current projections for Q1 GDP range from 1.8% to 2.7%. There is probably some residual seasonality in the Q1 GDP numbers (pulling down GDP). So it is too early to revise down 2018 GDP.
At this point, as far as the impact of fiscal stimulus, the Fed has probably incorporated the estimated impact of the tax cuts in their projections for 2018 and beyond. So the FOMC might increase their projections a little.
| GDP projections of Federal Reserve Governors and Reserve Bank presidents | |||
|---|---|---|---|
| Change in Real GDP1 | 2018 | 2019 | 2020 |
| Dec 2017 | 2.2 to 2.6 | 1.9 to 2.3 | 1.7 to 2.0 |
| Sept 2017 | 2.0 to 2.3 | 1.7 to 2.1 | 1.6 to 2.0 |
The unemployment rate was at 4.1% again in February. So the unemployment rate for 2018 will probably be unchanged.
| Unemployment projections of Federal Reserve Governors and Reserve Bank presidents | |||
|---|---|---|---|
| Unemployment Rate2 | 2018 | 2019 | 2020 |
| Dec 2017 | 3.7 to 4.0 | 3.6 to 4.0 | 3.6 to 4.2 |
| Sept 2017 | 4.0 to 4.2 | 3.9 to 4.4 | 4.0 to 4.5 |
As of January, PCE inflation was up 1.65% from January 2017. Based on recent PCE readings, PCE inflation might be revised up slightly for 2018.
| Inflation projections of Federal Reserve Governors and Reserve Bank presidents | |||
|---|---|---|---|
| PCE Inflation1 | 2018 | 2019 | 2020 |
| Dec 2017 | 1.7 to 1.9 | 2.0 | 2.0 to 2.1 |
| Sept 2017 | 1.8 to 2.0 | 2.0 | 2.0 to 2.1 |
PCE core inflation was up 1.5% in January year-over-year. Core PCE inflation might be revised up slightly for 2018.
| Core Inflation projections of Federal Reserve Governors and Reserve Bank presidents | |||
|---|---|---|---|
| Core Inflation1 | 2018 | 2019 | 2020 |
| Dec 2017 | 1.7 to 1.9 | 2.0 | 2.0 to 2.1 |
| Sept 2017 | 1.8 to 2.0 | 2.0 | 2.0 to 2.1 |
In general the data has been consistent with the FOMC's December projections, so any revision will probably be related to the FOMC's view of the impact of policy.
Sunday, March 18, 2018
Sunday Night Futures
by Calculated Risk on 3/18/2018 07:37:00 PM
Weekend:
• Schedule for Week of Mar 18, 2018
• Goldman: FOMC Preview
Monday:
• No major economic releases scheduled.
From CNBC: Pre-Market Data and Bloomberg futures: S&P 500 are down 2, and DOW futures are down 20 (fair value).
Oil prices were mixed over the last week with WTI futures at $62.16 per barrel and Brent at $66.02 per barrel. A year ago, WTI was at $48, and Brent was at $51 - so oil prices are up solidly year-over-year.
Here is a graph from Gasbuddy.com for nationwide gasoline prices. Nationally prices are at $2.54 per gallon. A year ago prices were at $2.29 per gallon - so gasoline prices are up 25 cents per gallon year-over-year.
Goldman: FOMC Preview
by Calculated Risk on 3/18/2018 11:59:00 AM
A few brief excerpts from a note by Goldman Sachs economists Jan Hatzius and Spencer Hill: FOMC Preview: A Fast Start for the Powell Fed
The FOMC looks very likely to raise rates at next week’s meeting, the first with Chairman Powell at the helm ... we expect a slightly hawkish tone to next week’s meeting.
...
[We] expect the post-meeting statement to retain January’s upbeat tone ... but we expect the Committee’s optimism to come across more clearly in the SEP and the dots ... we do think the statement will acknowledge recent housing weakness.
...
The SEP is likely to show higher GDP growth projections for 2018, 2019, and longer-run, as well as a lower unemployment path and a modest inflation overshoot in 2020.
...
Public remarks by Fed officials suggest a broad shift in the committee’s outlook towards a potentially faster pace of tightening, and we expect the median dot to show four hikes in 2018, up from three at the December meeting.
Hotels: Occupancy Rate Up Year-over-Year
by Calculated Risk on 3/18/2018 08:41:00 AM
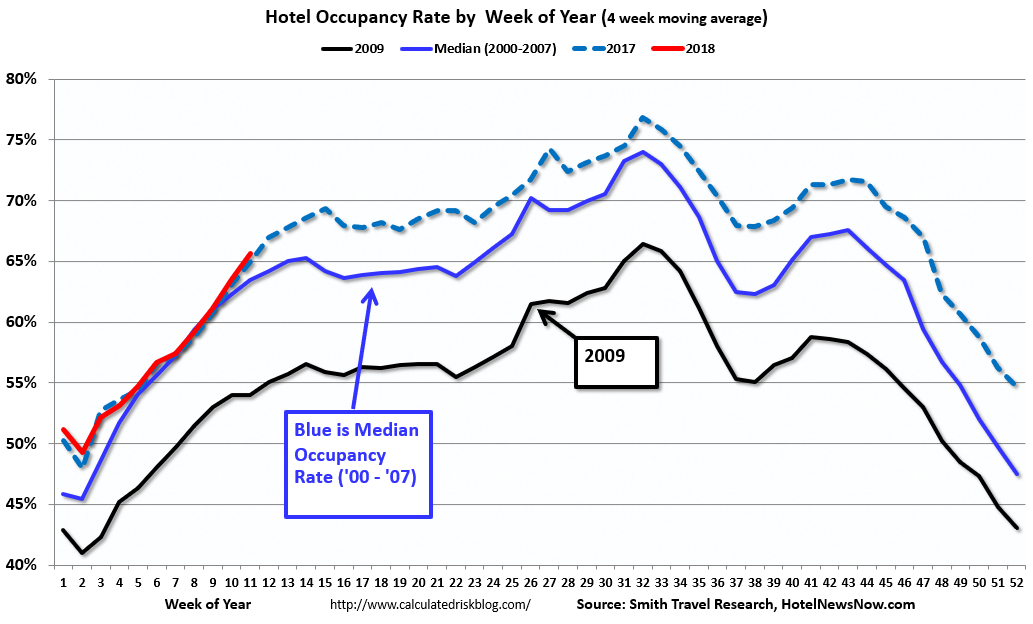
From HotelNewsNow.com: STR: US hotel results for week ending 10 March
The U.S. hotel industry reported positive year-over-year results in the three key performance metrics during the week of 4-10 March 2018, according to data from STR.The following graph shows the seasonal pattern for the hotel occupancy rate using the four week average.
In comparison with the week of 5-11 March 2017, the industry recorded the following:
• Occupancy: +1.1 at 68.1%
• Average daily rate (ADR): +2.0% to US$131.46
• Revenue per available room (RevPAR): +3.1% to US$89.53
emphasis added
 Click on graph for larger image.
The red line is for 2018, dash light blue is 2017 (record year due to hurricanes), blue is the median, and black is for 2009 (the worst year since the Great Depression for hotels).
Currently the occupancy rate, to date, is fifth overall - and slightly ahead of the record year in 2017 (2017 finished strong due to the impact of the hurricanes).
Data Source: STR, Courtesy of HotelNewsNow.com
Saturday, March 17, 2018
Schedule for Week of Mar 18, 2018
by Calculated Risk on 3/17/2018 08:11:00 AM
The key economic reports this week are February new home sales and existing home sales.
The FOMC meets this week and is expected to announce a 25bps increase in the Fed Funds rate.
No major economic releases scheduled.
No major economic releases scheduled.
7:00 AM ET: The Mortgage Bankers Association (MBA) will release the results for the mortgage purchase applications index.
 10:00 AM: Existing Home Sales for February from the National Association of Realtors (NAR). The consensus is for 5.42 million SAAR, up from 5.38 million in January.
The graph shows existing home sales from 1994 through the report last month.
Housing economist Tom Lawler will probably release his estimate on Monday. His preliminary estimate is 5.43 million SAAR for February.
During the day: The AIA's Architecture Billings Index for February (a leading indicator for commercial real estate).
2:00 PM: FOMC Meeting Announcement. The FOMC is expected to increase the Fed Funds rate 25 bps at this meeting.
2:00 PM: FOMC Forecasts This will include the Federal Open Market Committee (FOMC) participants' projections of the appropriate target federal funds rate along with the quarterly economic projections.
2:30 PM: Fed Chair Jerome Powell holds a press briefing following the FOMC announcement.
8:30 AM ET: The initial weekly unemployment claims report will be released. The consensus is for 225 thousand initial claims, up from 226 thousand the previous week.
9:00 AM: FHFA House Price Index for January 2018. This was originally a GSE only repeat sales, however there is also an expanded index.
11:00 AM: the Kansas City Fed manufacturing survey for March.
8:30 ET AM: Durable Goods Orders for February from the Census Bureau. The consensus is for a 0.1.72% increase in durable goods orders.
 10:00 AM: New Home Sales for February from the Census Bureau.
 This graph shows New Home Sales since 1963. The dashed line is the January sales rate.
The consensus is for 626 thousand SAAR, up from 593 thousand in January.
10:00 AM: State Employment and Unemployment (Monthly) for February 2018
Friday, March 16, 2018
Sacramento Housing in February: Sales up 10% YoY, Active Inventory up 17% YoY
by Calculated Risk on 3/16/2018 08:52:00 PM
From SacRealtor.org: Flat February: median sales price, sales volume stagnant
February closed with 1,131 sales, up just .2% from January’s 1,129 sales. Compared with one year ago (1,028), the current figure is a 10% increase. Of the 1,131 sales this month, 171 (15.1%) cash financing, 651 (57.6%) used conventional, 203 (17.9%) used FHA, 59 (5.2%) used VA and 47 (4.2%) used Other types of financing.CR Note: Inventory is still low, but now increasing year-over-year in Sacramento.
Active Listing Inventory increased 2.8% from 1,677 to 1,724. The Months of Inventory, however, remained at 1.5 Months. A year ago the Months of inventory was 1.4 and Active Listing Inventory stood at 1,469 listings (17.4% below the current figure).
The Average DOM (days on market) remained at 31 from month to month. The Median DOM dropped from 17 to 13.
“Days on market” represents the days between the initial listing of the home as “active” and the day it goes “pending.” 66.9% of all homes sold this month (757) were on the market for 30 days or less and 81.8% (925) of all homes sold in 60 days or less. Compare this to February 2016 where 78.8% of all homes sold (1,082) sold in 60 days or less.
emphasis added
The statistics for February are here.
Comments on February Housing Starts
by Calculated Risk on 3/16/2018 03:40:00 PM
Earlier: Housing Starts decreased to 1.236 Million Annual Rate in February
The housing starts report released this morning showed starts were down 7.0% in February compared to January, and starts were down 4.0% year-over-year compared to February 2017.
The decline in starts was due to the volatile multi-family sector. Single family starts were up 2.9% year.
This first graph shows the month to month comparison between 2017 (blue) and 2017 (red).
 Click on graph for larger image.
Starts were down 4.0% in February compared to February 2017.
Note that February 2016 was a pretty strong month for housing starts, so this was a difficult comparison. The next three months will be easier.
Through two months, starts are up 1.6% year-to-date compared to the same period in 2017.
Single family starts were up 2.9% year-over-year, and also up 2.9% compared to January.
Multi-family starts were down 18.7% year-over-year, and down 26.1% compared to January (multi-family is volatile month-to-month).
Below is an update to the graph comparing multi-family starts and completions. Since it usually takes over a year on average to complete a multi-family project, there is a lag between multi-family starts and completions. Completions are important because that is new supply added to the market, and starts are important because that is future new supply (units under construction is also important for employment).
These graphs use a 12 month rolling total for NSA starts and completions.
 The blue line is for multifamily starts and the red line is for multifamily completions.
The rolling 12 month total for starts (blue line) increased steadily over the last few years - but has turned down recently. Completions (red line) have lagged behind - and completions have caught up to starts (more deliveries).
Completions lag starts by about 12 months, so completions will probably turn down in a year or so.
As I've been noting for a few years, the growth in multi-family starts is behind us - multi-family starts peaked in June 2015 (at 510 thousand SAAR).
 The second graph shows single family starts and completions. It usually only takes about 6 months between starting a single family home and completion - so the lines are much closer. The blue line is for single family starts and the red line is for single family completions.
Note the low level of single family starts and completions. The "wide bottom" was what I was forecasting following the recession, and now I expect a few more years of increasing single family starts and completions.


