by Calculated Risk on 2/15/2018 09:31:00 AM
Thursday, February 15, 2018
Industrial Production Decreased 0.1% in January
From the Fed: Industrial Production and Capacity Utilization
Industrial production edged down 0.1 percent in January following four consecutive monthly increases. Manufacturing production was unchanged in January. Mining output fell 1.0 percent, with all of its major component industries recording declines, while the index for utilities moved up 0.6 percent. At 107.2 percent of its 2012 average, total industrial production was 3.7 percent higher in January than it was a year earlier. Capacity utilization for the industrial sector fell 0.2 percentage point in January to 77.5 percent, a rate that is 2.3 percentage points below its long-run (1972–2017) average.
 Click on graph for larger image.
This graph shows Capacity Utilization. This series is up 11.2 percentage points from the record low set in June 2009 (the series starts in 1967).
Capacity utilization at 77.5% is 2.3% below the average from 1972 to 2015 and below the pre-recession level of 80.8% in December 2007.
Note: y-axis doesn't start at zero to better show the change.
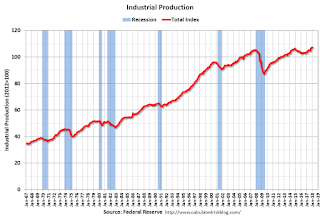 The second graph shows industrial production since 1967.
Industrial production decreased in January to 107.2. This is 23% above the recession low, and 2% above the pre-recession peak.
Weekly Initial Unemployment Claims increase to 230,000
by Calculated Risk on 2/15/2018 08:33:00 AM
The DOL reported:
In the week ending February 10, the advance figure for seasonally adjusted initial claims was 230,000, an increase of 7,000 from the previous week's revised level. The previous week's level was revised up by 2,000 from 221,000 to 223,000. The 4-week moving average was 228,500, an increase of 3,500 from the previous week's revised average. The previous week's average was revised up by 500 from 224,500 to 225,000.The previous week was revised up.
Claims taking procedures in Puerto Rico and in the Virgin Islands have still not returned to normal.
emphasis added
The following graph shows the 4-week moving average of weekly claims since 1971.
 Click on graph for larger image.
The dashed line on the graph is the current 4-week average. The four-week average of weekly unemployment claims increased to 228,500.
This was close to the consensus forecast. The low level of claims suggest relatively few layoffs.
Wednesday, February 14, 2018
Thursday: Unemployment Claims, PPI, NY and Philly Fed Mfg, Industrial Production, Homebuilder Confidence
by Calculated Risk on 2/14/2018 07:29:00 PM
From Matthew Graham at Mortgage News Daily: Things Just Keep Getting Worse For Mortgage Rates
Mortgage rates surged higher today, moving easily to new 4-year highs. Today's average conventional 30yr fixed rate is roughly one eighth of a percentage point higher than Wednesday of last week and more than half a point higher than the best rates seen in January. [30YR FIXED - 4.625%]Thursday:
emphasis added
• At 8:30 AM ET, The initial weekly unemployment claims report will be released. The consensus is for 229 thousand initial claims, up from 221 thousand the previous week.
• Also at 8:30 AM, the Philly Fed manufacturing survey for February. The consensus is for a reading of 21.5, down from 22.2.
• Also at 8:30 AM, The Producer Price Index for January from the BLS. The consensus is a 0.4% increase in PPI, and a 0.2% increase in core PPI.
• Also at 8:30 AM, The New York Fed Empire State manufacturing survey for February. The consensus is for a reading of 17.5, down from 17.7.
• At 9:15 AM, The Fed will release Industrial Production and Capacity Utilization for January. The consensus is for a 0.2% increase in Industrial Production, and for Capacity Utilization to increase to 78.0%.
• At 10:00 AM, The February NAHB homebuilder survey. The consensus is for a reading of 72, unchanged from 72 in January. Any number above 50 indicates that more builders view sales conditions as good than poor.
LA area Port Traffic Increases YoY in January
by Calculated Risk on 2/14/2018 05:02:00 PM
Container traffic gives us an idea about the volume of goods being exported and imported - and usually some hints about the trade report since LA area ports handle about 40% of the nation's container port traffic.
The following graphs are for inbound and outbound traffic at the ports of Los Angeles and Long Beach in TEUs (TEUs: 20-foot equivalent units or 20-foot-long cargo container).
To remove the strong seasonal component for inbound traffic, the first graph shows the rolling 12 month average.
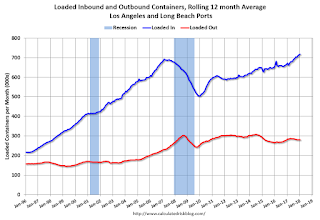
On a rolling 12 month basis, inbound traffic was up 0.4% compared to the rolling 12 months ending in December. Outbound traffic was down 0.3% compared to the rolling 12 months ending in December.
The 2nd graph is the monthly data (with a strong seasonal pattern for imports).

Trade has been strong - especially inbound - and setting record volumes most months recently.
In general imports have been increasing, and exports are mostly moving sideways to slightly down recently.
Key Measures Show Inflation Increased in January
by Calculated Risk on 2/14/2018 11:12:00 AM
The Cleveland Fed released the median CPI and the trimmed-mean CPI this morning:
According to the Federal Reserve Bank of Cleveland, the median Consumer Price Index rose 0.3% (4.2% annualized rate) in January. The 16% trimmed-mean Consumer Price Index also rose 0.3% (3.5% annualized rate) during the month. The median CPI and 16% trimmed-mean CPI are measures of core inflation calculated by the Federal Reserve Bank of Cleveland based on data released in the Bureau of Labor Statistics' (BLS) monthly CPI report.Note: The Cleveland Fed released the median CPI details for January here. Motor fuel was up sharply in January.
Earlier today, the BLS reported that the seasonally adjusted CPI for all urban consumers rose 0.5% (6.7% annualized rate) in January. The CPI less food and energy rose 0.3% (4.3% annualized rate) on a seasonally adjusted basis.
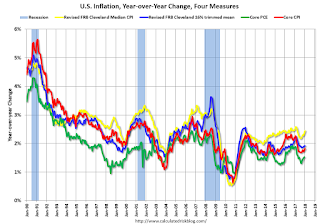 Click on graph for larger image.
This graph shows the year-over-year change for these four key measures of inflation. On a year-over-year basis, the median CPI rose 2.4%, the trimmed-mean CPI rose 1.9%, and the CPI less food and energy rose 1.8%. Core PCE is for December and increased 1.5% year-over-year.
On a monthly basis, median CPI was at 4.2% annualized, trimmed-mean CPI was at 3.5% annualized, and core CPI was at 4.3% annualized.
Using these measures, inflation picked up a little year-over-year in January. Overall, these measures are close, but still mostly below, the Fed's 2% target (Median CPI is slightly above).
Retail Sales decreased 0.3% in January
by Calculated Risk on 2/14/2018 08:41:00 AM
On a monthly basis, retail sales decreased 0.3 percent from December to January (seasonally adjusted), and sales were up 3.6 percent from January 2017.
From the Census Bureau report:
Advance estimates of U.S. retail and food services sales for January 2018, adjusted for seasonal variation and holiday and trading-day differences, but not for price changes, were $492.0 billion, a decrease of 0.3 percent from the previous month, but 3.6 percent above January 2017. ... The November 2017 to December 2017 percent change was revised from up 0.4 percent to virtually unchanged.
 Click on graph for larger image.
This graph shows retail sales since 1992. This is monthly retail sales and food service, seasonally adjusted (total and ex-gasoline).
Retail sales ex-gasoline were down 0.4% in January.
The second graph shows the year-over-year change in retail sales and food service (ex-gasoline) since 1993.
 Retail and Food service sales, ex-gasoline, increased by 3.5% on a YoY basis.
The increase in January was well below expectations, and sales in November and December were revised down sharply. A disappointing report.
MBA: Mortgage Applications Decrease in Latest Weekly Survey
by Calculated Risk on 2/14/2018 07:00:00 AM
From the MBA: Mortgage Applications Decrease in Latest MBA Weekly Survey
Mortgage applications decreased 4.1 percent from one week earlier, according to data from the Mortgage Bankers Association’s (MBA) Weekly Mortgage Applications Survey for the week ending February 9, 2018.
... The Refinance Index decreased 2 percent from the previous week. The seasonally adjusted Purchase Index decreased 6 percent from one week earlier. The unadjusted Purchase Index decreased 3 percent compared with the previous week and was 4 percent higher than the same week one year ago. ...
The average contract interest rate for 30-year fixed-rate mortgages with conforming loan balances ($453,100 or less) increased to its highest rate since January 2014, 4.57 percent, from 4.50 percent, with points increasing to 0.59 from 0.57 (including the origination fee) for 80 percent loan-to-value ratio (LTV) loans.
emphasis added
 Click on graph for larger image.
The first graph shows the refinance index since 1990.
Refinance activity will not pick up significantly unless mortgage rates fall well below 4%.
 The second graph shows the MBA mortgage purchase index
 According to the MBA, purchase activity is up 4% year-over-year.
Tuesday, February 13, 2018
Wednesday: CPI, Retail Sales
by Calculated Risk on 2/13/2018 08:56:00 PM
Wednesday:
• At 7:00 AM ET,The Mortgage Bankers Association (MBA) will release the results for the mortgage purchase applications index.
• At 8:30 AM, Retail sales for January will be released. The consensus is for a 0.3% increase in retail sales.
• Also at 8:30 AM, The Consumer Price Index for January from the BLS. The consensus is for a 0.3% increase in CPI, and a 0.2% increase in core CPI.
• At 10:00 AM, Manufacturing and Trade: Inventories and Sales (business inventories) report for December. The consensus is for a 0.2% increase in inventories.
NY Fed Q4 Report: "Household Debt Increased, Fifth Consecutive Year Of Positive Annual Growth"
by Calculated Risk on 2/13/2018 03:11:00 PM
From the NY Fed: Household Debt Jumps as 2017 Marks the Fifth Consecutive Year Of Positive Annual Growth Since Post-Recession Deleveraging
The Federal Reserve Bank of New York’s Center for Microeconomic Data today issued its Quarterly Report on Household Debt and Credit,which reported that total household debt increased by $193 billion (1.5%) to $13.15 trillion in the fourth quarter of 2017. This report marks the fifth consecutive year of positive annual household debt growth. There were increases in mortgage, student, auto, and credit card debt (increasing by 1.6%, 1.5%, 0.7% and 3.2% respectively) and another modest decline in home equity line of credit (HELOC) balances (decreasing by 0.9%). The Report is based on data from the New York Fed's Consumer Credit Panel, a nationally representative sample of individual- and household-level debt and credit records drawn from anonymized Equifax credit data.
Mortgages are the largest form of household debt and their increase of $139 billion was the most substantial increase seen in several quarters. Unlike overall debt balances, which last year surpassed their previous peak reached in the third quarter of 2008, mortgage balances remain 4.4% below it. The New York Fed issued an accompanying blog post to examine the regional differences in mortgage debt growth since the previous peak.
...
Bankruptcy notations decreased for the second consecutive quarter. ... Foreclosure notations remained essentially unchanged at the lowest levels observed in the New York Fed’s data.
emphasis added
 Click on graph for larger image.
Here are two graphs from the report:
The first graph shows aggregate consumer debt increased in Q4. Household debt previously peaked in 2008, and bottomed in Q2 2013.
From the NY Fed:
Mortgage balances, the largest component of household debt, increased substantially during the fourth quarter. Mortgage balances shown on consumer credit reports on December 31 stood at $8.88 trillion, an increase of $139 billion from the third quarter of 2017. Balances on home equity lines of credit (HELOC) declined again, by $4 billion and now stand at $444 billion. Non-housing balances, which have been increasing steadily for nearly 6 years overall, saw a $58 billion increase in the fourth quarter. Auto loans grew by $8 billion and credit card balances increased by $26 billion, while student loans saw a $21 billion increase.
 The second graph shows the percent of debt in delinquency. There is still a larger than normal percent of debt 90+ days delinquent (Yellow, orange and red).
The overall delinquency rate decreased in Q4. From the NY Fed:
Aggregate delinquency rates improved in the fourth quarter of 2017. As of December 31, 4.7% of outstanding debt was in some stage of delinquency. Of the $619 billion of debt that is delinquent, $406 billion is seriously delinquent (at least 90 days late or “severely derogatory”). The flow into 90+ days delinquency for credit card balances has been increasing notably from the last year and the flow into 90+ days delinquency for auto loan balances has been slowly increasing since 2012.There is much more in the report.
Demographics and GDP: 2% is the new 4%
by Calculated Risk on 2/13/2018 12:19:00 PM
Three years ago, I wrote Demographics and GDP: 2% is the new 4%. In that post I pointed out that due to demographics, slower GDP growth should have been expected over the last decade (contrary to political nonsense).
Yesterday, Greg Ip at the WSJ noted: Mulvaney: "People thought we were crazy" to forecast 2.3% 2017 growth. "We blew that out of the water." (Referring to John "Mick" Mulvaney, Director of the Office of Management and Budget).
What was real GDP growth in 2017? 2.3% according to the BEA. Too funny. (Maybe he meant Q4 over Q4, but that was only 2.5% - not exactly blown "out of the water".
This give me an excuse to update my graphs from my post three years ago. Overall, we should have been expecting slower growth this decade due to demographics - even without the housing bubble-bust and financial crisis.
One simple way to look at the change in GDP is as the change in the labor force, times the change in productivity. If the labor force is growing quickly, GDP will be higher with the same gains in productivity. And the opposite is true.
So here is a graph of the year-over-year change in the labor force since 1950 (data from the BLS).
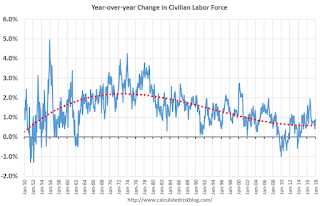
The data is noisy - because of changes in population controls and the business cycle - but the pattern is clear as indicated by the dashed red trend line. The labor force has been growing slowly after declining for some time.
We could also look at just the prime working age population - I've pointed out before the that prime working age population has started growing again.
Now here is a look at GDP for the same period.

GDP was high in the early 50s - and early-to-mid 60s because of government spending (Korean and Vietnam wars). As in example, in 1951, national defense added added 6.5 percentage points to GDP. Of course we don't want another war ...
Now lets put the two graphs together.
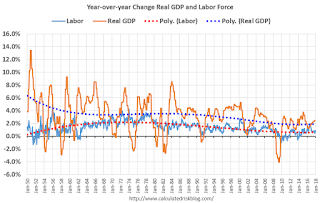
The good news is that the working age population will be growing faster going forward. The bad news is the political hacks will continue to ignore demographics.
However, due to demographics, 2% GDP growth is the new 4%. (Note: with improving demographics, maybe 2.5% is the new 4% now)


