 RSS Feed
 by Calculated Risk on 12/20/2017 01:52:00 PM
Wednesday, December 20, 2017
A Few Comments on November Existing Home Sales
Earlier: NAR: "Existing-Home Sales Soar 5.6 Percent in November"
A few key points:
1) As usual, housing economist Tom Lawler's forecast was closer to the NAR report than the consensus. See: Lawler: Early Read on Existing Home Sales in November. The consensus was for sales of 5.52 million SAAR in November. Lawler estimated 5.77 million, and the NAR reported 5.81 million.
""Based on what I've seen so far, I project that existing home sales as estimated by the National Association of Realtors ran at a seasonally adjusted annual rate of 5.77 million in November."2) There might have been some bounce back in November from the hurricanes.
3) Inventory is still very low and falling year-over-year (down 9.7% year-over-year in November). More inventory would probably mean smaller price increases, and less inventory somewhat larger price increases. This was the 30th consecutive month with a year-over-year decline in inventory.
The following graph shows existing home sales Not Seasonally Adjusted (NSA).
 Click on graph for larger image.
Sales NSA in November (427,000, red column) were above sales in November 2016 (418,000, NSA) and at the highest level for November since 2006 (472,000).
Sales NSA are now slowing seasonally, and sales NSA will be lower through February.
AIA: Architecture Billings Index Increases in November
by Calculated Risk on 12/20/2017 11:37:00 AM
Note: This index is a leading indicator primarily for new Commercial Real Estate (CRE) investment.
From the AIA: Architecture billings upturn shows broad strength
Even with the uncertainty related to pending tax reform legislation that likely will have a mixed effect on the construction industry, design services at architecture firms remains in high demand. The American Institute of Architects (AIA) reported the November ABI score was 55.0, up from a score of 51.7 in the previous month. This score reflects an increase in design services provided by U.S. architecture firms (any score above 50 indicates an increase in billings). The new projects inquiry index was 61.1, up from a reading of 60.2 the previous month, while the new design contracts index rose slightly from 52.8 to 53.2.
“Not only are design billings overall seeing their strongest growth of the year, the strength is reflected in all major regions and construction sectors,” said AIA Chief Economist, Kermit Baker, Hon. AIA, PhD. “The construction industry continues to show surprising momentum heading into 2018.”
...
• Regional averages: West (54.8), Northeast (52.8), South (52.8), Midwest (50.4)
• Sector index breakdown: multi-family residential (53.9), mixed practice (53.6), commercial / industrial (53.3), institutional (52.4)
emphasis added
 Click on graph for larger image.
This graph shows the Architecture Billings Index since 1996. The index was at 55.0 in November, up from 51.7 in October. Anything above 50 indicates expansion in demand for architects' services.
Note: This includes commercial and industrial facilities like hotels and office buildings, multi-family residential, as well as schools, hospitals and other institutions.
According to the AIA, there is an "approximate nine to twelve month lag time between architecture billings and construction spending" on non-residential construction. This index was positive in 10 of the last 12 months, suggesting a further increase in CRE investment into 2018.
NAR: "Existing-Home Sales Soar 5.6 Percent in November"
by Calculated Risk on 12/20/2017 10:19:00 AM
From the NAR: Existing-Home Sales Soar 5.6 Percent in November to Strongest Pace in Over a Decade
Existing-home sales surged for the third straight month in November and reached their strongest pace in almost 11 years, according to the National Association of Realtors®. All major regions except for the West saw a significant hike in sales activity last month.
Total existing-home sales, which are completed transactions that include single-family homes, townhomes, condominiums and co-ops, jumped 5.6 percent to a seasonally adjusted annual rate of 5.81 million in November from an upwardly revised 5.50 million in October. After last month’s increase, sales are 3.8 percent higher than a year ago and are at their strongest pace since December 2006 (6.42 million).
...
Total housing inventory at the end of November dropped 7.2 percent to 1.67 million existing homes available for sale, and is now 9.7 percent lower than a year ago (1.85 million) and has fallen year-over-year for 30 consecutive months. Unsold inventory is at a 3.4-month supply at the current sales pace, which is down from 4.0 months a year ago.
emphasis added
 Click on graph for larger image.
This graph shows existing home sales, on a Seasonally Adjusted Annual Rate (SAAR) basis since 1993.
Sales in November (5.81 million SAAR) were 5.6% higher than last month, and were 3.8% above the November 2016 rate.
The second graph shows nationwide inventory for existing homes.
 According to the NAR, inventory decreased to 1.67 million in November from 1.80 million in October. Headline inventory is not seasonally adjusted, and inventory usually decreases to the seasonal lows in December and January, and peaks in mid-to-late summer.
The last graph shows the year-over-year (YoY) change in reported existing home inventory and months-of-supply. Since inventory is not seasonally adjusted, it really helps to look at the YoY change. Note: Months-of-supply is based on the seasonally adjusted sales and not seasonally adjusted inventory.
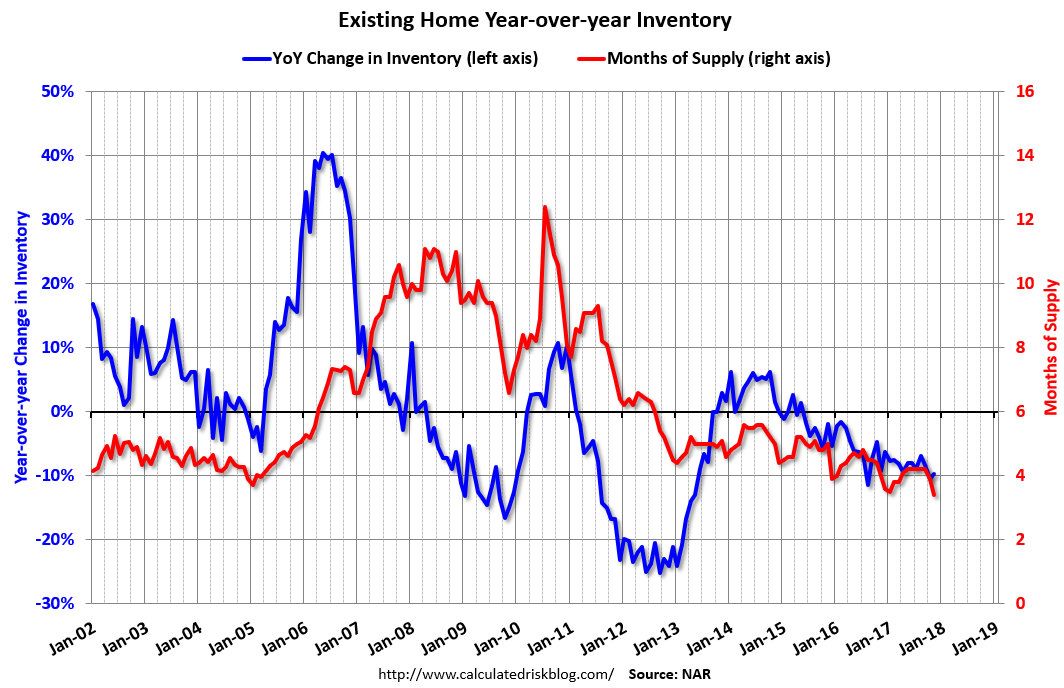 Inventory decreased 9.7% year-over-year in November compared to November 2016.
 Months of supply was at 3.4 months in November.
As expected by CR readers, sales were above the consensus view. For existing home sales, a key number is inventory - and inventory is still low. I'll have more later ...
MBA: Mortgage Applications Decrease in Latest Weekly Survey
by Calculated Risk on 12/20/2017 07:00:00 AM
From the MBA: Mortgage Applications Decrease in Latest MBA Weekly Survey
Mortgage applications decreased 4.9 percent from one week earlier, according to data from the Mortgage Bankers Association’s (MBA) Weekly Mortgage Applications Survey for the week ending December 15, 2017.
... The Refinance Index decreased 3 percent from the previous week. The seasonally adjusted Purchase Index decreased 6 percent from one week earlier. The unadjusted Purchase Index decreased 9 percent compared with the previous week and was 1 percent higher than the same week one year ago. ...
The average contract interest rate for 30-year fixed-rate mortgages with conforming loan balances ($424,100 or less) decreased to 4.16 percent from 4.20 percent, with points decreasing to 0.35 from 0.39 (including the origination fee) for 80 percent loan-to-value ratio (LTV) loans.
emphasis added
 Click on graph for larger image.
The first graph shows the refinance index since 1990.
Refinance activity will not pick up significantly unless mortgage rates fall well below 4%.
 The second graph shows the MBA mortgage purchase index.
 According to the MBA, purchase activity is up 1% year-over-year.
Tuesday, December 19, 2017
Wednesday: Existing Home Sales
by Calculated Risk on 12/19/2017 07:33:00 PM
Wednesday:
• At 7:00 AM ET, The Mortgage Bankers Association (MBA) will release the results for the mortgage purchase applications index.
• At 10:00 AM, Existing Home Sales for November from the National Association of Realtors (NAR). The consensus is for 5.52 million SAAR, up from 5.48 million in October. Housing economist Tom Lawler expects the NAR to report sales of 5.77 million SAAR for November.
• During the day, The AIA's Architecture Billings Index for November (a leading indicator for commercial real estate).
Sacramento Housing in November: Sales down 3% YoY, Active Inventory up 8% YoY
by Calculated Risk on 12/19/2017 02:14:00 PM
During the recession, I started following the Sacramento market to look for changes in the mix of houses sold (equity, REOs, and short sales). For several years, not much changed. But in 2012 and 2013, we saw some significant changes with a dramatic shift from distressed sales to more normal equity sales.
Note: The Sacramento Association of REALTORS® started breaking out REOs in May 2008, and short sales in June 2009.
In November, total sales were down 2.6% from November 2016, and conventional equity sales were up 1.7% compared to the same month last year.
In November, 2.3% of all resales were distressed sales. This was up from 1.4% last month, and down from 5.0% in November 2016.
Sacramento Realtor Press Release: October marks highest median sales price in 10.5 years
October ended with a 3.2% decrease in sales, down from 1,560inSeptemberto 1,510. Compared with the 1,584 sales of October 2016, the current number is a 4.7% decrease. Equity sales for the month continued to grow, accounting for 98.5% (1,510) of the sales this month. REO/bank-owned and Short Sales made up the difference with 11 sales (.7%) and 11 sales (.7%) for the month, respectively.Here are the statistics.
...
Active Listing Inventory decreased slightly, decreasing 3.4% from 2,625 to 2,536.The Months of Inventory remained at 1.7 Months. A year ago the Months of inventory was 1.6 and Active Listing Inventory stood at 2,492 listings(-1.8% from current figure).
emphasis added
 Click on graph for larger image.
 This graph shows the percent of REO sales, short sales and conventional sales.
There has been a sharp increase in conventional (equity) sales that started in 2012 (blue) as the percentage of distressed sales declined sharply.
Active Listing Inventory for single family homes increased 8.3% year-over-year (YoY) in November. This is the second consecutive month with a YoY inventory increase, following 29 consecutive months with a YoY decrease in inventory in Sacramento.
Cash buyers accounted for 12.9% of all sales - this has been generally declining (frequently investors).
Summary: This data suggests a normal market with few distressed sales, and less investor buying - but with limited inventory. Keep an eye on inventory - this might be a change in trend.
Chemical Activity Barometer Increased in December
by Calculated Risk on 12/19/2017 12:45:00 PM
Note: This appears to be a leading indicator for industrial production.
From the American Chemistry Council: 2017 Closes with Strong Commercial and Industrial Activity Suggesting Healthy Business Growth Through Third Quarter 2018
The Chemical Activity Barometer (CAB), a leading economic indicator created by the American Chemistry Council (ACC), expanded 0.6 percent in December on a three-month moving average (3MMA) basis and 0.4 percent on an unadjusted basis. The CAB is up 3.7 percent compared to a year earlier. Barometer readings were revised upwards for November (0.22), October (0.39) and September (0.08) as 2017 closes on a solid note, suggesting further business activity gains through the third quarter of 2018.
...
Applying the CAB back to 1912, it has been shown to provide a lead of two to fourteen months, with an average lead of eight months at cycle peaks as determined by the National Bureau of Economic Research. The median lead was also eight months. At business cycle troughs, the CAB leads by one to seven months, with an average lead of four months. The median lead was three months. The CAB is rebased to the average lead (in months) of an average 100 in the base year (the year 2012 was used) of a reference time series. The latter is the Federal Reserve’s Industrial Production Index.
emphasis added
 Click on graph for larger image.
This graph shows the year-over-year change in the 3-month moving average for the Chemical Activity Barometer compared to Industrial Production. It does appear that CAB (red) generally leads Industrial Production (blue).
CAB increased solidly in early 2017 suggesting an increase in Industrial Production. The year-over-year increase in the CAB has slowed recently, but this still suggests further gains in industrial production in 2018.
Comments on November Housing Starts
by Calculated Risk on 12/19/2017 10:00:00 AM
Earlier: Housing Starts increased to 1.297 Million Annual Rate in November
The housing starts report released this morning showed starts were up 3.3% in November compared to October, and starts were up 12.9% year-over-year compared to November 2016.
Single family starts, at 930 thousand SAAR, were at the highest level since September 2007 (over 10 years ago).
This first graph shows the month to month comparison between 2016 (blue) and 2017 (red).
 Click on graph for larger image.
Starts were up 12.9% in November 2017 compared to November 2016 (a fairly easy comparison), and starts are up only 3.1% year-to-date.
Note that single family starts are up 8.7% year-to-date, and the weakness (as expected) has been in multi-family starts.
My guess was starts would increase around 3% to 7% in 2017. It looks like starts will be at the low end of that range.
Below is an update to the graph comparing multi-family starts and completions. Since it usually takes over a year on average to complete a multi-family project, there is a lag between multi-family starts and completions. Completions are important because that is new supply added to the market, and starts are important because that is future new supply (units under construction is also important for employment).
These graphs use a 12 month rolling total for NSA starts and completions.
 The blue line is for multifamily starts and the red line is for multifamily completions.
The rolling 12 month total for starts (blue line) increased steadily over the last few years - but has turned down recently. Completions (red line) have lagged behind - and completions have caught up to starts (more deliveries).
Completions lag starts by about 12 months, so completions will probably turn down in about a year.
As I've been noting for a couple of years, the growth in multi-family starts is behind us - multi-family starts peaked in June 2015 (at 510 thousand SAAR).
 The second graph shows single family starts and completions. It usually only takes about 6 months between starting a single family home and completion - so the lines are much closer. The blue line is for single family starts and the red line is for single family completions.
Note the low level of single family starts and completions. The "wide bottom" was what I was forecasting following the recession, and now I expect a few more years of increasing single family starts and completions.
Housing Starts increased to 1.297 Million Annual Rate in November
by Calculated Risk on 12/19/2017 08:43:00 AM
From the Census Bureau: Permits, Starts and Completions
Housing Starts:
Privately-owned housing starts in November were at a seasonally adjusted annual rate of 1,297,000. This is 3.3 percent above the revised October estimate of 1,256,000 and is 12.9 percent above the November 2016 rate of 1,149,000. Single-family housing starts in November were at a rate of 930,000; this is 5.3 percent above the revised October figure of 883,000. The November rate for units in buildings with five units or more was 359,000.
Building Permits:
Privately-owned housing units authorized by building permits in November were at a seasonally adjusted annual rate of 1,298,000. This is 1.4 percent below the revised October rate of 1,316,000, but is 3.4 percent above the November 2016 rate of 1,255,000. Single-family authorizations in November were at a rate of 862,000; this is 1.4 percent above the revised October figure of 850,000. Authorizations of units in buildings with five units or more were at a rate of 395,000 in November.
emphasis added
 Click on graph for larger image.
The first graph shows single and multi-family housing starts for the last several years.
Multi-family starts (red, 2+ units) decreased slightly in November compared to October. However Multi-family starts were up year-over-year.
Multi-family is volatile month-to-month, but has been mostly moving sideways to down recently.
Single-family starts (blue) increased in November, and are up solidly year-over-year.
 The second graph shows total and single unit starts since 1968.
 The second graph shows the huge collapse following the housing bubble, and then - after moving sideways for a couple of years - housing is now recovering (but still historically low),
Total housing starts in November were above expectations. Starts for September and October were revised down, combined.
I'll have more later ...
Monday, December 18, 2017
Tuesday: Housing Starts
by Calculated Risk on 12/18/2017 08:19:00 PM
From Matthew Graham at Mortgage News Daily: Mortgage Rates Rise Only Slightly Despite Weaker Market Cues
Mortgage rates bounced modestly higher today, bringing the average lender back in line with last Wednesday's levels. Bond markets (which underlie mortgage rate movement) suggested a slightly bigger bounce. We may not have seen such a bounce simply due to timing. Specifically, bonds weakened throughout the day, but few lenders adjusted rate sheets in the afternoon. As such, we could begin the day tomorrow at a bit of a disadvantage, unless bond markets improve overnight.Tuesday:
For several months, 4.0% has been the most prevalently-quoted conventional 30yr fixed rate on top tier scenarios. We discuss "rates" as moving up and down during that time but in reality, the only things moving are the upfront closing costs associated with that rate. It's not uncommon for rates to be exceptionally flat heading into the end of the year, but in this case, they began flattening out in late September.
emphasis added
• At 8:30 AM, Housing Starts for November. The consensus is for 1.240 million SAAR, down from the October rate of 1.290 million.


