 RSS Feed
 by Calculated Risk on 10/05/2017 01:57:00 PM
Thursday, October 05, 2017
Goldman: September Payrolls Preview
A few brief excerpts from a note by Goldman Sachs economist Spencer Hill:
We estimate that nonfarm payroll growth slowed to +50k in September, below consensus of +80k and the 3-month average pace of +185k. Our forecast reflects the widespread flooding and power outages caused by Hurricanes Harvey and Irma, which affected over 10% of the population and caused over $100bn in damages. The impact on tomorrow’s report is highly uncertain, but our base-case assumes a significant impact of -125k that partially offsets continued job growth in the rest of the country.CR Note: I posted an employment preview yesterday.
We also expect the hurricanes to weigh on the household survey results ... we estimate a rise [in the unemployment rate] to 4.5%). Finally, we estimate average hourly earnings increased 0.4% month over month and 2.7% year over year, reflecting positive calendar effects.
emphasis added
Trade Deficit at $42.4 Billion in August
by Calculated Risk on 10/05/2017 09:34:00 AM
Earlier from the Department of Commerce reported:
The U.S. Census Bureau and the U.S. Bureau of Economic Analysis, through the Department of Commerce, announced today that the goods and services deficit was $42.4 billion in August, down $1.2 billion from $43.6 billion in July, revised. August exports were $195.3 billion, $0.8 billion more than July exports. August imports were $237.7 billion, $0.4 billion less than July imports.
 Click on graph for larger image.
Exports increased, and imports decreased, in August.
Exports are 18% above the pre-recession peak and up 4% compared to August 2016; imports are 2% above the pre-recession peak, and up 4% compared to August 2016.
In general, trade has been picking up.
The second graph shows the U.S. trade deficit, with and without petroleum.
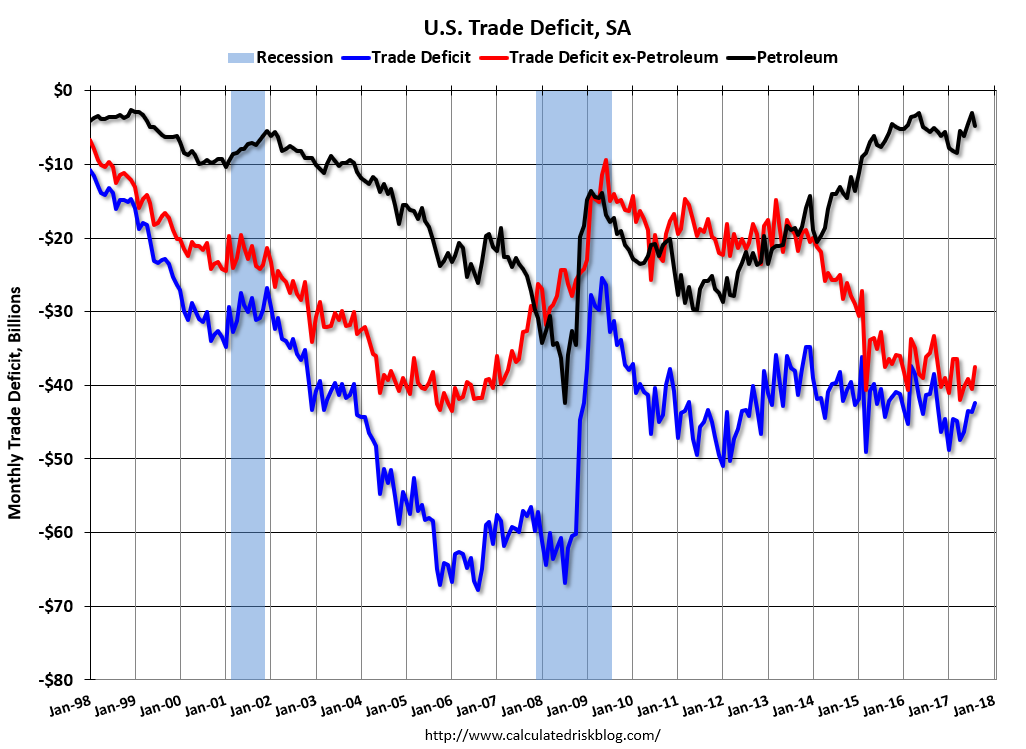 The blue line is the total deficit, and the black line is the petroleum deficit, and the red line is the trade deficit ex-petroleum products.
Oil imports averaged $44.11 in August, up from $43.20 in July, and up from $39.38 in August 2016. The petroleum deficit had been declining for years - and is the major reason the overall deficit has mostly moved sideways since early 2012.
The trade deficit with China increased to $34.9 billion in August, from $33.9 billion in August 2016.
Weekly Initial Unemployment Claims decrease to 260,000
by Calculated Risk on 10/05/2017 08:33:00 AM
The DOL reported:
In the week ending September 30, the advance figure for seasonally adjusted initial claims was 260,000, a decrease of 12,000 from the previous week's unrevised level of 272,000. The 4-week moving average was 268,250, a decrease of 9,500 from the previous week's unrevised average of 277,750.The previous week was unrevised.
Hurricanes Harvey and Irma impacted this week's claims.
emphasis added
The following graph shows the 4-week moving average of weekly claims since 1971.
 Click on graph for larger image.
The dashed line on the graph is the current 4-week average. The four-week average of weekly unemployment claims decreased to 268,250.
This was slightly below the consensus forecast. The recent increase in claims is due to the hurricanes.
Wednesday, October 04, 2017
Thursday: Trade Deficit, Unemployment Claims
by Calculated Risk on 10/04/2017 06:32:00 PM
From Matthew Graham at Mortgage News Daily: Mortgage Rates Still Holding Near Recent Highs
Mortgage rates were very slightly lower today, but not by enough to have an impact on the actual interest rates being quoted. Specifically, the "effective rate"--which factors upfront costs into an overall cost of financing is slightly lower due to changes in those upfront costs. But borrowers will be seeing the same interest rate at the top of the page on today's loan quotes compared to yesterday. [30YR FIXED - 3.875-4.0%]Thursday:
• At 8:30 AM ET, The initial weekly unemployment claims report will be released. The consensus is for 265 thousand initial claims, down from 272 thousand the previous week.
• Also at 8:30 AM, Trade Balance report for August from the Census Bureau. The consensus is for the U.S. trade deficit to be at $42.5 billion in August from $43.7 billion in July.
September Employment Preview
by Calculated Risk on 10/04/2017 01:58:00 PM
On Friday at 8:30 AM ET, the BLS will release the employment report for September. A key question is how much hurricanes Harvey and Irma impacted employment in September. Merrill Lynch economists noted this morning:
"While Hurricane Irma made landfall on September 10th, preparations and evacuations began well in advance of the storm which likely impacted business and employment activity to start the month. Moreover, many homes and businesses remained without power throughout the week of September 10th (the BLS’s survey reference week) which could also distort the payroll figures. The unemployment rate should not be materially affected as workers who were not at work due to weather issues would still be counted as employed in the household survey."In September 2005, following Hurricane Katrina in late August of that year, the BLS initially reported 35,000 jobs lost (later revised up to a gain of 67,000 jobs). That was a sharp slowdown from prior months - and something similar probably happened this year.
Note: Puerto Rico is not included in the national employment report.
The consensus, according to Bloomberg, is for an increase of 100,000 non-farm payroll jobs in September (with a range of estimates between 0 to 140,000), and for the unemployment rate to be unchanged at 4.4%.
The BLS reported 156,000 jobs added in August.
Here is a summary of recent data:
• The ADP employment report showed an increase of 135,000 private sector payroll jobs in September. This was below consensus expectations of 150,000 private sector payroll jobs added. The ADP report hasn't been very useful in predicting the BLS report for any one month, but in general, this suggests employment growth below expectations.
• The ISM manufacturing employment index increased in September to 60.3%. A historical correlation between the ISM manufacturing employment index and the BLS employment report for manufacturing, suggests that private sector BLS manufacturing payroll increased about 35,000 in September. The ADP report indicated manufacturing jobs increased 18,000 in September.
The ISM non-manufacturing employment index increased in September to 56.8%. A historical correlation between the ISM non-manufacturing employment index and the BLS employment report for non-manufacturing, suggests that private sector BLS non-manufacturing payroll jobs increased about 255,000 in September.
Combined, the ISM indexes suggests employment gains of about 290,000. This suggests employment growth well above expectations.
• Initial weekly unemployment claims averaged 278,000 in September, up sharply from 237,000 in August. For the BLS reference week (includes the 12th of the month), initial claims were at 260,000, up from 232,000 during the reference week in August.
The increase during the reference week suggests a weaker employment report in September than in August.
• The final September University of Michigan consumer sentiment index decreased to 95.1 from the August reading of 96.8. Sentiment is frequently coincident with changes in the labor market, but there are other factors too like gasoline prices and politics.
• Conclusion: It is difficult to guess the impact of the hurricanes on the employment report. The ADP report and weekly claims suggest a weaker employment report. The ISM surveys probably miss the impact of the hurricanes - otherwise those reports would suggest solid employment gains in September. My guess is the employment report comes in below the consensus forecast.
Note: Any number below 152,000 jobs means the year-over-year gain in employment will fall below 2 million for the first time since early 2013. A negative headline payroll number (not impossible), would break the streak of 83 consecutive months of job gains - by far the longest streak of positive monthly gains in BLS history.
ISM Non-Manufacturing Index increased to 59.8% in September
by Calculated Risk on 10/04/2017 10:05:00 AM
The September ISM Non-manufacturing index was at 59.8%, up from 55.3% in August. The employment index increased in September to 56.8%, from 56.2%. Note: Above 50 indicates expansion, below 50 contraction.
From the Institute for Supply Management: September 2017 Non-Manufacturing ISM Report On Business®
Economic activity in the non-manufacturing sector grew in September for the 93rd consecutive month, say the nation’s purchasing and supply executives in the latest Non-Manufacturing ISM® Report On Business®.
The report was issued today by Anthony Nieves, CPSM, C.P.M., A.P.P., CFPM, Chair of the Institute for Supply Management® (ISM®) Non-Manufacturing Business Survey Committee: "The NMI® registered 59.8 percent, which is 4.5 percentage points higher than the August reading of 55.3 percent. This represents continued growth in the non-manufacturing sector at a faster rate. This is the highest reading since August 2005 when the index registered 61.3 percent. The Non-Manufacturing Business Activity Index increased to 61.3 percent, 3.8 percentage points higher than the August reading of 57.5 percent, reflecting growth for the 98th consecutive month, at a faster rate in September. The New Orders Index registered 63 percent, 5.9 percentage points higher than the reading of 57.1 percent in August. The Employment Index increased 0.6 percentage point in September to 56.8 percent from the August reading of 56.2 percent. The Prices Index increased substantially by 8.4 percentage points from the August reading of 57.9 percent to 66.3 percent, indicating prices increased in September for the fourth consecutive month. This is the highest reading since February 2012 when the index registered 67.6 percent. According to the NMI®, 15 non-manufacturing industries reported growth. The non-manufacturing sector has reflected strong growth in the month of September despite the impact on the supply chain from the recent hurricanes. Respondents’ comments indicate a good outlook for business conditions."
emphasis added
 Click on graph for larger image.
This graph shows the ISM non-manufacturing index (started in January 2008) and the ISM non-manufacturing employment diffusion index.
This suggests faster expansion in September than in August.
ADP: Private Employment increased 135,000 in September
by Calculated Risk on 10/04/2017 08:19:00 AM
Private sector employment increased by 135,000 jobs from August to September according to the September ADP National Employment Report®. ... The report, which is derived from ADP’s actual payroll data, measures the change in total nonfarm private employment each month on a seasonally-adjusted basis.This was below the consensus forecast for 150,000 private sector jobs added in the ADP report.
...
“In September, small businesses experienced a dip in hiring,” said Ahu Yildirmaz, vice president and cohead of the ADP Research Institute. “This is in part due to Hurricane’s Harvey and Irma which significantly impacted smaller retailers. “In addition, the continued slow down we have seen in small business hiring could be due to a lack of competitive compensation to attract skilled talent.”
Mark Zandi, chief economist of Moody’s Analytics, said, “Hurricanes Harvey and Irma hurt the job market in September. Looking through the storms the job market remains sturdy and strong.”
The BLS report for September will be released Friday, and the consensus is for 95,000 non-farm payroll jobs added in September.
MBA: Mortgage Applications Decrease Slightly in Latest Weekly Survey
by Calculated Risk on 10/04/2017 07:00:00 AM
From the MBA: Purchase Apps Up, Refi Apps Down in Latest MBA Weekly Survey
Mortgage applications decreased 0.4 percent from one week earlier, according to data from the Mortgage Bankers Association’s (MBA) Weekly Mortgage Applications Survey for the week ending September 29, 2017.
... The Refinance Index decreased 2 percent from the previous week. The seasonally adjusted Purchase Index increased 1 percent from one week earlier. The unadjusted Purchase Index increased 1 percent compared with the previous week and was 5 percent higher than the same week one year ago. ...
The average contract interest rate for 30-year fixed-rate mortgages with conforming loan balances ($424,100 or less) increased to 4.12 percent from 4.11 percent, with points increasing to 0.45 from 0.40 (including the origination fee) for 80 percent loan-to-value ratio (LTV) loans.
emphasis added
 Click on graph for larger image.
The first graph shows the refinance index since 1990.
Refinance activity will not pick up significantly unless mortgage rates fall well below 4%.
 The second graph shows the MBA mortgage purchase index.
 According to the MBA, purchase activity is up 5% year-over-year.
Tuesday, October 03, 2017
Wednesday: ADP Employment, ISM Non-Mfg Index
by Calculated Risk on 10/03/2017 08:55:00 PM
Wednesday:
• At 7:00 AM ET, The Mortgage Bankers Association (MBA) will release the results for the mortgage purchase applications index.
• At 8:15 AM, The ADP Employment Report for September. This report is for private payrolls only (no government). The consensus is for 150,000 payroll jobs added in September, down from 237,000 added in August.
• At 10:00 AM, the ISM non-Manufacturing Index for September. The consensus is for index to increase to 55.4 from 55.3 in August.
• At 3:15 PM, Speech by Fed Chair Janet Yellen, Brief welcoming remarks, At the Community Banking in the 21st Century Research and Policy Conference, hosted by the Federal Reserve System and the Conference of State Bank Supervisors, St. Louis, Missouri
U.S. Light Vehicle Sales at 18.4 million annual rate in September
by Calculated Risk on 10/03/2017 03:08:00 PM
Based on a preliminary estimate from WardsAuto (ex-Porsche and Hyundai), light vehicle sales were at a 18.4 million SAAR in September.
That is up 4% from September 2016, and up 14.8% from last month.

Click on graph for larger image.
This graph shows the historical light vehicle sales from the BEA (blue) and an estimate for August (red, light vehicle sales of 18.4 million SAAR mostly from WardsAuto).
This was well above the consensus forecast of 16.7 million for September (Note: Hurricane Harvey pushed down sales at the end of August - and this was part of the bounce back).
Still, after two consecutive years of record sales, vehicle sales will be down in 2017.
 The second graph shows light vehicle sales since the BEA started keeping data in 1967.
Note: dashed line is current estimated sales rate.


