 RSS Feed
 by Calculated Risk on 9/30/2017 08:11:00 AM
Saturday, September 30, 2017
Schedule for Week of Oct 1, 2017
The key report this week is the September employment report on Friday.
Other key indicators include the September ISM manufacturing and non-manufacturing indexes, September auto sales and the August Trade deficit.
Early: Reis Q3 2017 Mall Survey of rents and vacancy rates.
 10:00 AM: ISM Manufacturing Index for September. The consensus is for the ISM to be at 58.0, down from 58.8 in August.
Here is a long term graph of the ISM manufacturing index.
The ISM manufacturing index indicated expansion in August. The PMI was at 58.8% in August, the employment index was at 59.9%, and the new orders index was at 60.3%.
10:00 AM: Construction Spending for August. The consensus is for a 0.3% increase in construction spending.
 All day: Light vehicle sales for September. The consensus is for light vehicle sales to be 16.7 million SAAR in September, up from 16.1 million in August (Seasonally Adjusted Annual Rate).
This graph shows light vehicle sales since the BEA started keeping data in 1967. The dashed line is the August sales rate.
10:00 AM ET: The CoreLogic House Price index for August.
7:00 AM ET: The Mortgage Bankers Association (MBA) will release the results for the mortgage purchase applications index.
8:15 AM: The ADP Employment Report for September. This report is for private payrolls only (no government). The consensus is for 150,000 payroll jobs added in September, down from 237,000 added in August.
10:00 AM: the ISM non-Manufacturing Index for September. The consensus is for index to increase to 55.4 from 55.3 in August.
3:15 PM: Speech by Fed Chair Janet Yellen, Brief welcoming remarks, At the Community Banking in the 21st Century Research and Policy Conference, hosted by the Federal Reserve System and the Conference of State Bank Supervisors, St. Louis, Missouri
8:30 AM ET: The initial weekly unemployment claims report will be released. The consensus is for 265 thousand initial claims, down from 272 thousand the previous week.
 8:30 AM: Trade Balance report for August from the Census Bureau.
 This graph shows the U.S. trade deficit, with and without petroleum, through July. The blue line is the total deficit, and the black line is the petroleum deficit, and the red line is the trade deficit ex-petroleum products.
The consensus is for the U.S. trade deficit to be at $42.5 billion in August from $43.7 billion in July.
8:30 AM: Employment Report for September. The consensus is for an increase of 95,000 non-farm payroll jobs added in September, down from the 156,000 non-farm payroll jobs added in August.
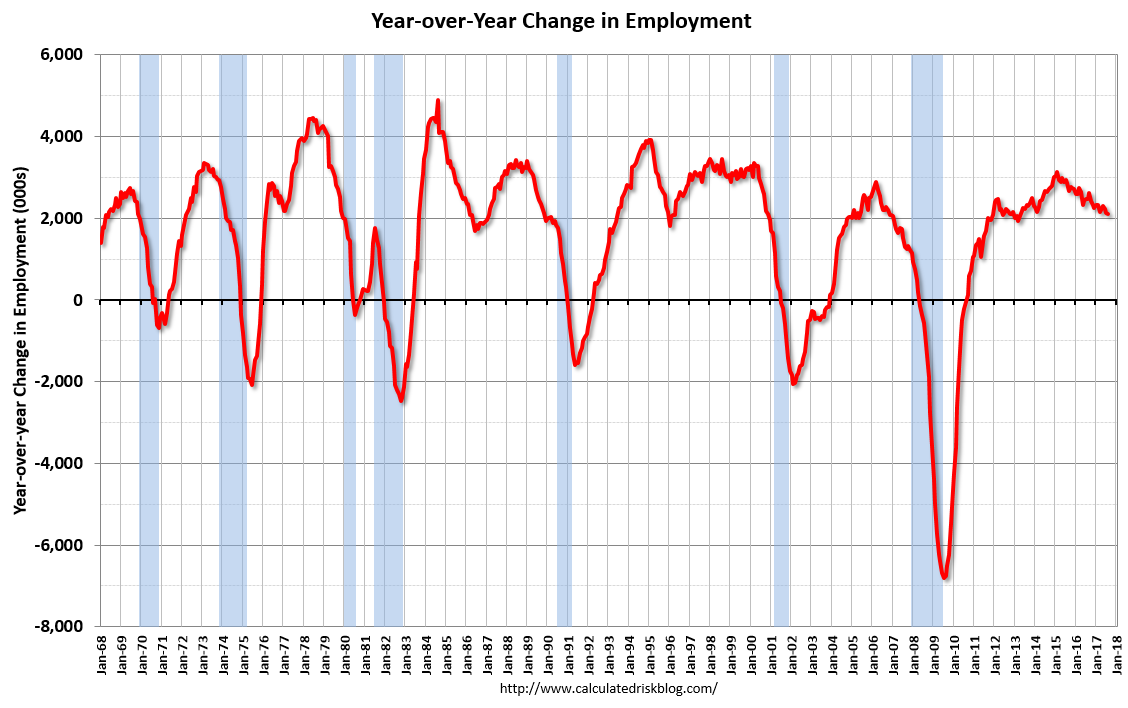 The consensus is for the unemployment rate to increase to 4.4%.
This graph shows the year-over-year change in total non-farm employment since 1968.
In August the year-over-year change was 2.10 million jobs.
A key will be the change in wages.
3:00 PM: Consumer Credit for August from the Federal Reserve.
Friday, September 29, 2017
Fannie Mae: Mortgage Serious Delinquency rate declined in August, Lowest since December 2007
by Calculated Risk on 9/29/2017 04:39:00 PM
Fannie Mae reported that the Single-Family Serious Delinquency rate declined to 0.99% in August, from 1.00% in July. The serious delinquency rate is down from 1.24% in August 2016.
This is the lowest serious delinquency rate since December 2007.
These are mortgage loans that are "three monthly payments or more past due or in foreclosure".
The Fannie Mae serious delinquency rate peaked in February 2010 at 5.59%.
 Click on graph for larger image
By vintage, for loans made in 2004 or earlier (4% of portfolio), 2.65% are seriously delinquent. For loans made in 2005 through 2008 (7% of portfolio), 5.71% are seriously delinquent, For recent loans, originated in 2009 through 2017 (89% of portfolio), only 0.32% are seriously delinquent. So Fannie is still working through poor performing loans from the bubble years.
In the short term - over the next several months - the delinquency rate will probably increase slightly due to the hurricanes. After the hurricane bump, maybe the rate will decline another 0.3 percentage points or so to a cycle bottom, but this is pretty close to normal.
Note: Freddie Mac reported earlier.
Oil Rigs "Signs of life in the rig count"
by Calculated Risk on 9/29/2017 02:33:00 PM
A few comments from Steven Kopits of Princeton Energy Advisors LLC on Sept 29, 2017:
• Rig counts were off modestly this week
• Total US oil rigs were up 6 to 750
• Horizontal oil rigs were up 6 to 640
...
• WTI suggests we have seen the rig bottom for the mini-cycle.
 Click on graph for larger image.
CR note: This graph shows the US horizontal rig count by basin.
Graph and comments Courtesy of Steven Kopits of Princeton Energy Advisors LLC.
Q3 GDP Forecasts: Close to 2%
by Calculated Risk on 9/29/2017 11:43:00 AM
From the Altanta Fed: GDPNow
The GDPNow model forecast for real GDP growth (seasonally adjusted annual rate) in the third quarter of 2017 is 2.3 percent on September 29, up from 2.1 percent on September 27. Since the previous GDPNow update on Wednesday, the forecasts of the contributions of net exports and inventory investment to third-quarter GDP growth increased from -0.16 percentage points and 0.90 percentage points, respectively, to -0.01 percentage points and 1.13 percentage points, respectively. The forecasts of real consumer spending growth and real nonresidential equipment investment growth declined from 2.0 percent and 5.7 percent, respectively, to 1.8 percent and 4.0 percent, respectively.From the NY Fed Nowcasting Report
emphasis added
The New York Fed Staff Nowcast stands at 1.5% for 2017:Q3 and 2.0% for 2017:Q4.CR Note: Based on the August report, PCE looks sluggish in Q3 (mid-month method at 1.7%).
Reis: Office Vacancy Rate "flat" in Q3 at 16.1%
by Calculated Risk on 9/29/2017 10:21:00 AM
Reis released their Q3 2017 Office Vacancy survey this morning. Reis reported that the office vacancy rate was unchanged at 16.1% in Q3, from 16.1% in Q2. This is also unchanged from 16.1% in Q3 2016, and down from the cycle peak of 17.6%.
From Reis Economist Barbara Denham:
Continuing its steady but sluggish pace, the office market recorded no change in vacancy rate in the third quarter. Currently at 16.1% for the second quarter in a row, the national office vacancy rate has moderated between 16.0% and 16.1% for the last seven quarters. Construction fell to 6.5 million square feet from 10.4 million last quarter and 8.1 million in the third quarter of 2016. Net absorption, or occupancy growth, was in line with construction at 5.4 million. Last quarter’s net absorption was 4.8 million square feet, and third quarter 2016 net absorption was 3.7 million square feet.
Although the office market seems to be stalling in this expansion with a persistently high vacancy rate relative to previous expansions — vacancy fell to 12.5% in 2007 from 17.0% in 2003 — one could argue that the market is in equilibrium as occupancy growth moves in line with inventory growth. Still, office employment growth in 2017 for the metro areas has averaged 2.0% (year-over-year through August), down from an average annual growth rate of 2.4% in 2016 and 2.8% in 2015. This means that office demand growth has been slightly weaker over the last eight months than in previous years. ...
Asking and effective rents have both increased 1.5% since the third quarter of 2016. This is the lowest year-over-year rent growth rate since 2011 and the third quarter in a row that year-over-year effective rent growth was below 2%.
 Click on graph for larger image.
This graph shows the office vacancy rate starting in 1980 (prior to 1999 the data is annual).
Reis reported the vacancy rate was at 16.1% in Q3. The office vacancy rate is moving sideways at an elevated level.
Office vacancy data courtesy of Reis.
Personal Income increased 0.2% in August, Spending increased 0.1%
by Calculated Risk on 9/29/2017 08:35:00 AM
The BEA released the Personal Income and Outlays report for August:
Personal income increased $28.6 billion (0.2 percent) in August according to estimates released today by the Bureau of Economic Analysis ... personal consumption expenditures (PCE) increased $18.0 billion (0.1 percent).The August PCE price index increased 1.4 percent year-over-year and the August PCE price index, excluding food and energy, increased 1.3 percent year-over-year.
...
Real PCE decreased 0.1 percent. The PCE price index increased 0.2 percent. Excluding food and energy, the PCE price index increased 0.1 percent.
The following graph shows real Personal Consumption Expenditures (PCE) through August 2017 (2009 dollars). Note that the y-axis doesn't start at zero to better show the change.
 Click on graph for larger image.
The dashed red lines are the quarterly levels for real PCE.
The increase in personal income was below expectations, and the increase in PCE was at expectations.
Using the two-month method to estimate Q3 PCE growth, PCE was increasing at a 1.7% annual rate in Q3 2017. (using the mid-month method, PCE was increasing 1.0%). This suggests sluggish PCE growth in Q3.
Thursday, September 28, 2017
Friday: Personal Income and Outlays, Chicago PMI and More
by Calculated Risk on 9/28/2017 06:50:00 PM
From Matthew Graham at Mortgage News Daily: Mortgage Rates Trying to Find a Ceiling
Mortgage rates were decidedly higher this morning, with most lenders back above last week's highs. At the time, those were the highest rates in more than a month, although the range has been relatively narrow. Underlying bond markets improved throughout the day, however, resulting in a fair amount of lenders revising rate sheets for the better. After those revisions, rates are pretty close to yesterday's levels. [30YR FIXED - 3.875-4.0%]Friday:
• At 8:30 AM ET, Personal Income and Outlays for August. The consensus is for a 0.3% increase in personal income, and for a 0.1% increase in personal spending. And for the Core PCE price index to increase 0.2%.
• Early, Reis Q3 2017 Office Survey of rents and vacancy rates.
• At 9:45 AM, Chicago Purchasing Managers Index for September. The consensus is for a reading of 58.6, down from 58.9 in August.
• At 10:00 AM: University of Michigan's Consumer sentiment index (final for September). The consensus is for a reading of 97.2, unchanged from the preliminary reading 97.6.
New Home Prices
by Calculated Risk on 9/28/2017 01:49:00 PM
As part of the new home sales report released on Tuesday, the Census Bureau reported the number of homes sold by price and the average and median prices.
From the Census Bureau: "The median sales price of new houses sold in August 2017 was $300,200. The average sales price was $368,100."
The following graph shows the median and average new home prices.
 Click on graph for larger image.
During the housing bust, the builders had to build smaller and less expensive homes to compete with all the distressed sales. When housing started to recovery - with limited finished lots in recovering areas - builders moved to higher price points to maximize profits.
The average price in August 2017 was $368,100, and the median price was $300,200. Both are above the bubble high (this is due to both a change in mix and rising prices).
The second graph shows the percent of new homes sold by price.
 About 4% of new homes sold were under $150K in August 2017. This is about the same as in August 2016, but down from 30% in 2002. In general, the under $150K bracket is going away.
The $400K+ bracket has increased significantly. I'll break that bracket up in the future.
A majority of new homes, in the U.S., are in the $200K to $400K range.
Kansas City Fed: Regional Manufacturing Activity "Continued to Expand Solidly" in September
by Calculated Risk on 9/28/2017 11:00:00 AM
From the Kansas City Fed: Tenth District Manufacturing Activity Continued to Expand Solidly
The Federal Reserve Bank of Kansas City released the September Manufacturing Survey today. According to Chad Wilkerson, vice president and economist at the Federal Reserve Bank of Kansas City, the survey revealed that Tenth District manufacturing activity continued to expand at a solid pace and that firms remained optimistic about the future.This was the last of the regional Fed surveys for September.
“Factories in the region reported another good month in September, with little impact overall from the Gulf Coast hurricanes,” said Wilkerson.
...
The month-over-month composite index was 17 in September, up from 16 in August and 10 in July. The composite index is an average of the production, new orders, employment, supplier delivery time, and raw materials inventory indexes. Factory activity increased solidly at both durable and non-durable goods plants, particularly for chemicals, plastics, and machinery products. Month-over-month indexes were somewhat mixed. The production index remained unchanged, while the shipments, employment, and new orders for exports indexes increased mildly. In contrast, the new orders index fell from 25 to 10, and the order backlog index also decreased. The finished goods inventory index fell from 2 to -6, while the raw materials inventory index was mostly unchanged.
emphasis added
Here is a graph comparing the regional Fed surveys and the ISM manufacturing index:
 Click on graph for larger image.
The New York and Philly Fed surveys are averaged together (yellow, through September), and five Fed surveys are averaged (blue, through September) including New York, Philly, Richmond, Dallas and Kansas City. The Institute for Supply Management (ISM) PMI (red) is through August (right axis).
Based on these regional surveys, it seems likely the ISM manufacturing index will be strong again in September (to be released Monday, Oct 2nd).
Weekly Initial Unemployment Claims increase to 272,000
by Calculated Risk on 9/28/2017 08:35:00 AM
The DOL reported:
In the week ending September 23, the advance figure for seasonally adjusted initial claims was 272,000, an increase of 12,000 from the previous week's revised level. The previous week's level was revised up by 1,000 from 259,000 to 260,000. The 4-week moving average was 277,750, an increase of 9,000 from the previous week's unrevised average of 268,750. This is the highest level for this average since February 6, 2016 when it was 277,750.The previous week was revised up.
Hurricanes Harvey and Irma impacted this week's claims.
emphasis added
The following graph shows the 4-week moving average of weekly claims since 1971.
 Click on graph for larger image.
The dashed line on the graph is the current 4-week average. The four-week average of weekly unemployment claims increased to 277,750.
This was slightly above the consensus forecast. The recent increase in claims is due to the hurricanes.


