by Calculated Risk on 9/25/2017 01:44:00 PM
Monday, September 25, 2017
Duy: "Has The Fed Abandoned Its Reaction Function?"
From economist Tim Duy at FedWatch: Has The Fed Abandoned Its Reaction Function?
The immediate policy outcomes of the FOMC meeting were largely as expected. Central bankers left interest rates unchanged while announcing that the reduction of the balance sheet will begin in October as earlier outlined in June. The real action was in the Summary of Economic Projections. Policymakers continue to anticipate one more rate hike this year and three next. This policy stance looks inconsistent with the downward revisions to projections of inflation and the neutral rate; under the Fed’s earlier reaction function, the combination of the two would drive down rate projections. Arguably, policy is thus no longer as data dependent as the Fed would like us to believe. That or the reaction function has changed.
...
The economic forecasts were somewhat confounding. Policymakers edged up their growth forecasts, but still anticipate that unemployment will end the year at 4.3%.
The unemployment forecast for the next two years edged down 0.1 percentage point, but this relative stability is somewhat confusing given that growth is expected to exceed potential growth until 2020 (remember, the Fed believes that labor force participation is more likely to fall than rise, so strong growth should induce downward pressure on unemployment).
...
Bottom line: the Fed is strongly committed to rate hikes. The[y] don’t appear to be following their earlier reaction function; policy feels path dependent at the moment. Indeed, given the Fed’s expectation of low inflation and volatile and possibly weak data due to the hurricanes, it is difficult to see what stops the Fed from hiking in December.
Dallas Fed: "Growth in Texas Manufacturing Activity Holds Steady" in September
by Calculated Risk on 9/25/2017 10:44:00 AM
From the Dallas Fed: Growth in Texas Manufacturing Activity Holds Steady
Texas factory activity continued to increase in September, according to business executives responding to the Texas Manufacturing Outlook Survey. The production index, a key measure of state manufacturing conditions, edged down to 19.5 from 20.3 in August, indicating output grew at about the same pace as last month.The regional reports released so far for September have been solid.
Other measures of current manufacturing activity also indicated continued growth. The new orders index increased and the growth rate of orders index ticked down but stayed positive, coming in at 18.6 and 9.7, respectively. The capacity utilization index edged up four points to 15.8, while the shipments index jumped nine points to 27.4.
Perceptions of broader business conditions improved in September. The general business activity index increased to 21.3, its highest reading in seven months. The company outlook index posted its 13th consecutive positive reading, jumping nine points to 25.6.
Labor market measures suggested faster employment growth and longer workweeks this month. The employment index came in at 16.3, its highest level since April 2014. Twenty-eight percent of firms noted net hiring, compared with 11 percent noting net layoffs. The hours worked index rose four points to 18.4.
emphasis added
Black Knight: House Price Index up 0.5% in July, Up 6.2% year-over-year
by Calculated Risk on 9/25/2017 09:30:00 AM
Note: I follow several house price indexes (Case-Shiller, CoreLogic, Black Knight, Zillow, FHFA, FNC and more). Note: Black Knight uses the current month closings only (not a three month average like Case-Shiller or a weighted average like CoreLogic), excludes short sales and REOs, and is not seasonally adjusted.
From Black Knight: Black Knight Home Price Index Report: Monthly Rate of Appreciation Slows as U.S. Home Prices Gain 0.5 Percent in July, Year-Over-Year Growth Steady at 6.2 Percent
• The rate of growth in year-over-year price appreciation stabilized in July after accelerating throughout every month of 2017The year-over-year increase in this index has been about the same for the last year (in the 5% and 6% range).
• After hitting a high of 1.3 percent in March 2017, the rate of monthly appreciation has steadily slowed over subsequent months
• July marks 63 consecutive months of annual home price appreciation
• Of the 20 largest states, only Virginia saw home prices pull back, with a 0.2 percent month-over-month decline from June
Note that house prices are above the bubble peak in nominal terms, but not in real terms (adjusted for inflation). Case-Shiller for July will be released tomorrow.
Chicago Fed "Index points to slower economic growth in August"
by Calculated Risk on 9/25/2017 08:38:00 AM
From the Chicago Fed: Index points to slower economic growth in August
Led by declines in production-related indicators, the Chicago Fed National Activity Index (CFNAI) moved down to –0.31 in August from +0.03 in July. Two of the four broad categories of indicators that make up the index decreased from July, and two of the four categories made negative contributions to the index in August. The index’s three-month moving average, CFNAI-MA3, decreased to –0.04 in August from a neutral reading in July.This graph shows the Chicago Fed National Activity Index (three month moving average) since 1967.
emphasis added
 Click on graph for larger image.
This suggests economic activity was close to the historical trend in August (using the three-month average).
According to the Chicago Fed:
The index is a weighted average of 85 indicators of growth in national economic activity drawn from four broad categories of data: 1) production and income; 2) employment, unemployment, and hours; 3) personal consumption and housing; and 4) sales, orders, and inventories.
...
A zero value for the monthly index has been associated with the national economy expanding at its historical trend (average) rate of growth; negative values with below-average growth (in standard deviation units); and positive values with above-average growth.
Sunday, September 24, 2017
Sunday Night Futures
by Calculated Risk on 9/24/2017 08:50:00 PM
Weekend:
• Schedule for Week of Sept 24, 2017
Monday:
• At 8:30 AM ET, Chicago Fed National Activity Index for August. This is a composite index of other data.
• At 10:30 AM, Dallas Fed Survey of Manufacturing Activity for September.
From CNBC: Pre-Market Data and Bloomberg futures: S&P 500 are up 3, and DOW futures are up 35 (fair value).
Oil prices were up over the last week with WTI futures at $50.60 per barrel and Brent at $56.83 per barrel. A year ago, WTI was at $45, and Brent was at $47 - so oil prices are up 10% to 20% year-over-year.
Here is a graph from Gasbuddy.com for nationwide gasoline prices. Nationally prices are at $2.55 per gallon - up sharply due to Hurricane Harvey, but now declining - a year ago prices were at $2.20 per gallon - so gasoline prices are up 35 cents per gallon year-over-year.
Hotel Occupancy Rate just Behind Record Year
by Calculated Risk on 9/24/2017 11:00:00 AM
From HotelNewsNow.com: STR: US hotel results for week ending 16 September
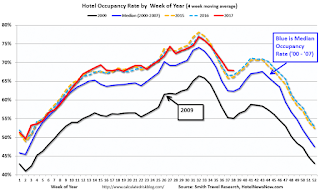
The U.S. hotel industry reported positive year-over-year results in the three key performance metrics during the week of 10-16 September 2017, according to data from STR.The following graph shows the seasonal pattern for the hotel occupancy rate using the four week average.
In comparison with the week of 11-17 September 2016, the industry recorded the following:
• Occupancy: +0.5% to 72.2%
• Average daily rate (ADR): +1.4% to US$131.50
• Revenue per available room (RevPAR): +1.8% to US$94.97
Among the Top 25 Markets, Houston, Texas, reported the largest year-over-year increases in occupancy (+43.3% to 87.8%) and RevPAR (+58.6% to US$103.24). Amid recovery from Hurricane Harvey, Houston also posted an ADR increase of 10.7% to US$117.63.
Tampa/St. Petersburg, Florida, posted the second-highest lift in occupancy (+13.8% to 70.3%), that coupled with the highest increase in ADR (+14.1% to US$119.06), led the second-largest jump in RevPAR (+29.9% to US$83.75).
emphasis added
 The red line is for 2017, dash light blue is 2016, dashed orange is 2015 (best year on record), blue is the median, and black is for 2009 (the worst year since the Great Depression for hotels).
Currently the occupancy rate, to date, is ahead of last year, and just behind the record year in 2015. The hurricanes might push the annual occupancy rate to a new record.
Seasonally, the occupancy rate will increase into the Fall business travel season.
Data Source: STR, Courtesy of HotelNewsNow.com
Saturday, September 23, 2017
Schedule for Week of Sept 24, 2017
by Calculated Risk on 9/23/2017 08:09:00 AM
The key economic report this week is New Home sales for August on Tuesday.
Other key indicators include the third estimate of Q2 GDP, and July Case-Shiller house prices.
8:30 AM ET: Chicago Fed National Activity Index for August. This is a composite index of other data.
10:30 AM: Dallas Fed Survey of Manufacturing Activity for September.
 9:00 AM ET: S&P/Case-Shiller House Price Index for July.
This graph shows the nominal seasonally adjusted National Index, Composite 10 and Composite 20 indexes through the June 2017 report (the Composite 20 was started in January 2000).
The consensus is for a 5.9% year-over-year increase in the Comp 20 index for July.
Early: Reis Q3 2017 Apartment Survey of rents and vacancy rates.
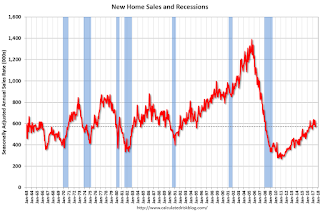
 10:00 AM ET: New Home Sales for August from the Census Bureau.
 This graph shows New Home Sales since 1963. The dashed line is the July sales rate.
The consensus is for 583 thousand SAAR, unchanged from 571 thousand in July.
10:00 AM: Richmond Fed Survey of Manufacturing Activity for September.
12:45 PM: Speech by Fed Chair Janet Yellen, Inflation, Uncertainty, and Monetary Policy, 59th NABE Annual Meeting, Cleveland, Ohio
7:00 AM ET: The Mortgage Bankers Association (MBA) will release the results for the mortgage purchase applications index.
8:30 AM: Durable Goods Orders for August from the Census Bureau. The consensus is for a 1.5% increase in durable goods orders.
10:00 AM: Pending Home Sales Index for August. The consensus is for a 0.1% decrease in the index.
8:30 AM ET: The initial weekly unemployment claims report will be released. The consensus is for 270 thousand initial claims, up from 259 thousand the previous week.
8:30 AM: Gross Domestic Product, 2nd quarter 2017 (Third estimate). The consensus is that real GDP increased 3.1% annualized in Q2, up from second estimate of 3.0%.
11:00 AM: the Kansas City Fed manufacturing survey for September.
Early: Reis Q3 2017 Office Survey of rents and vacancy rates.
8:30 AM: Personal Income and Outlays for August. The consensus is for a 0.3% increase in personal income, and for a 0.1% increase in personal spending. And for the Core PCE price index to increase 0.2%.
9:45 AM: Chicago Purchasing Managers Index for September. The consensus is for a reading of 58.6, down from 58.9 in August.
10:00 AM: University of Michigan's Consumer sentiment index (final for September). The consensus is for a reading of 97.2, unchanged from the preliminary reading 97.6.
Friday, September 22, 2017
Vehicle Forecast: Sales Expected to Exceed 17 million SAAR in September
by Calculated Risk on 9/22/2017 02:56:00 PM
The automakers will report September vehicle sales on Tuesday, October 3rd.
Note: There were 26 selling days in September 2017, there were 25 in September 2016.
From WardsAuto: Forecast: SAAR Expected to Surpass 17 Million in September
A WardsAuto forecast calls for U.S. light-vehicle sales to reach a 17.5 million-unit seasonally adjusted annual rate in September, following August’s 16.0 million SAAR and ending a 6-month streak of sub-17 million figures. In same-month 2016, the SAAR reached 17.6 million.Sales have been below 17 million SAAR for six consecutive months.
...
Preliminary assumptions pointed to October, rather than September, as the turning point for the market, as consumers replace vehicles lost due to natural disasters and automakers push sales to clear out excess model-year ’17 stock. However, the winds have already begun to turn, and September sales will be significantly higher than originally expected.
emphasis added
Mortgage Equity Withdrawal slightly positive in Q2
by Calculated Risk on 9/22/2017 10:23:00 AM
Note: This is not Mortgage Equity Withdrawal (MEW) data from the Fed. The last MEW data from Fed economist Dr. Kennedy was for Q4 2008.
The following data is calculated from the Fed's Flow of Funds data (released yesterday) and the BEA supplement data on single family structure investment. This is an aggregate number, and is a combination of homeowners extracting equity - hence the name "MEW" - and normal principal payments and debt cancellation (modifications, short sales, and foreclosures).
For Q2 2017, the Net Equity Extraction was a positive $12 billion, or a positive 0.3% of Disposable Personal Income (DPI) .

This graph shows the net equity extraction, or mortgage equity withdrawal (MEW), results, using the Flow of Funds (and BEA data) compared to the Kennedy-Greenspan method.
Note: This data is impacted by debt cancellation and foreclosures, but much less than a few years ago.
The Fed's Flow of Funds report showed that the amount of mortgage debt outstanding increased by $64 billion in Q2.
The Flow of Funds report also showed that Mortgage debt has declined by $1.23 trillion since the peak. This decline is mostly because of debt cancellation per foreclosures and short sales, and some from modifications. There has also been some reduction in mortgage debt as homeowners paid down their mortgages so they could refinance.
With a slower rate of debt cancellation, MEW will likely be mostly positive going forward.
For reference:
Dr. James Kennedy also has a simple method for calculating equity extraction: "A Simple Method for Estimating Gross Equity Extracted from Housing Wealth". Here is a companion spread sheet (the above uses my simple method).
For those interested in the last Kennedy data included in the graph, the spreadsheet from the Fed is available here.
Update: For Fun, Stock Market as Barometer of Policy Success
by Calculated Risk on 9/22/2017 08:11:00 AM
Note: This is a repeat of a June post with updated statistics and graph.
There are a number of observers who think the stock market is the key barometer of policy success. My view is there are many measures of success - and that the economy needs to work well for a majority of the people - not just stock investors.
However, for example, Treasury Secretary Steven Mnuchin was on CNBC on Feb 22, 2017, and was asked if the stock market rally was a vote of confidence in the new administration, he replied: "Absolutely, this is a mark-to-market business, and you see what the market thinks."
And Larry Kudlow wrote in 2007: A Stock Market Vote of Confidence for Bush: "I have long believed that stock markets are the best barometer of the health, wealth and security of a nation. And today's stock market message is an unmistakable vote of confidence for the president."
Note: Kudlow's comments were made a few months before the market started selling off in the Great Recession. For more on Kudlow, see: Larry Kudlow is usually wrong
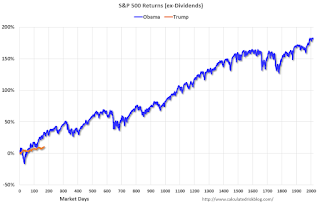
For fun, here is a graph comparing S&P500 returns (ex-dividends) under Presidents Trump and Obama:

Blue is for Mr. Obama, Orange is for Mr. Trump.
At this point, the S&P500 is up 10.1% under Mr. Trump compared to up 32.2% under Mr. Obama for the same number of market days.


