by Calculated Risk on 8/12/2017 08:11:00 AM
Saturday, August 12, 2017
Schedule for Week of Aug 13, 2017
The key economic reports this week are July retail sales and Housing Starts.
For manufacturing, July industrial production, and the August New York and Philly Fed manufacturing surveys, will be released this week.
No major economic releases scheduled.
 8:30 AM ET: Retail sales for July will be released. The consensus is for a 0.3% increase in retail sales.
This graph shows retail sales since 1992 through June 2017.
8:30 AM: The New York Fed Empire State manufacturing survey for August. The consensus is for a reading of 10.0, up from 9.8.
10:00 AM: Manufacturing and Trade: Inventories and Sales (business inventories) report for June. The consensus is for a 0.4% increase in inventories.
10:00 AM: The August NAHB homebuilder survey. The consensus is for a reading of 65, up from 64 in July. Any number above 50 indicates that more builders view sales conditions as good than poor.
7:00 AM ET: The Mortgage Bankers Association (MBA) will release the results for the mortgage purchase applications index.
 8:30 AM: Housing Starts for July. The consensus is for 1.225 million SAAR, up from the June rate of 1.215 million.
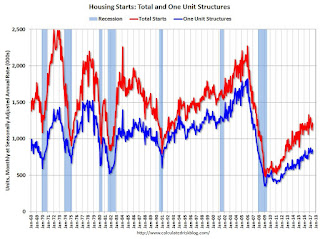
This graph shows total and single unit starts since 1968.
The graph shows the huge collapse following the housing bubble, and then - after moving sideways for a couple of years - housing is now recovering.
2:00 PM: FOMC Minutes for the Meeting of 25 - 26, 2017
8:30 AM ET: The initial weekly unemployment claims report will be released. The consensus is for 241 thousand initial claims, down from 244 thousand the previous week.
8:30 AM: the Philly Fed manufacturing survey for August. The consensus is for a reading of 17.0, down from 19.5.
 9:15 AM: The Fed will release Industrial Production and Capacity Utilization for July.
This graph shows industrial production since 1967.
The consensus is for a 0.3% increase in Industrial Production, and for Capacity Utilization to increase to 76.7%.
10:00 AM: University of Michigan's Consumer sentiment index (preliminary for August). The consensus is for a reading of 93.9, up from 93.4 in July.
10:00 AM: Regional and State Employment and Unemployment (Monthly) for July 2017
Friday, August 11, 2017
Q3 GDP Forecasts
by Calculated Risk on 8/11/2017 02:45:00 PM
From the Altanta Fed: GDPNow
The GDPNow model forecast for real GDP growth (seasonally adjusted annual rate) in the third quarter of 2017 is 3.5 percent on August 9, down from 3.7 percent on August 4.From the NY Fed Nowcasting Report
The New York Fed Staff Nowcast stands at 2.0% for 2017:Q3. The effects of news from this week’s data releases were small, leaving the nowcast broadly unchanged.From Merrill Lynch:
3Q GDP tracking remained unchanged on net at 2.8%. 2Q tracking was bumped up a tenth to 2.5%, owing to better wholesale inventories data.CR Note: Looks like real GDP growth will probably be in the 2s again in Q3.
Key Measures Show Inflation mostly below 2% in July
by Calculated Risk on 8/11/2017 11:16:00 AM
The Cleveland Fed released the median CPI and the trimmed-mean CPI this morning:
According to the Federal Reserve Bank of Cleveland, the median Consumer Price Index rose 0.2% (2.0% annualized rate) in July. The 16% trimmed-mean Consumer Price Index also rose 0.2% (1.8% annualized rate) during the month. The median CPI and 16% trimmed-mean CPI are measures of core inflation calculated by the Federal Reserve Bank of Cleveland based on data released in the Bureau of Labor Statistics' (BLS) monthly CPI report.Note: The Cleveland Fed released the median CPI details for July here. Motor fuel declined 14% in July annualized.
Earlier today, the BLS reported that the seasonally adjusted CPI for all urban consumers rose 0.1% (1.3% annualized rate) in July. The CPI less food and energy also rose 0.1% (1.4% annualized rate) on a seasonally adjusted basis.
 Click on graph for larger image.
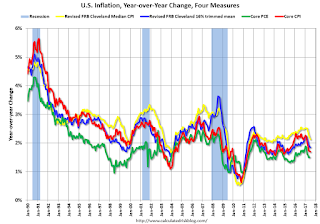
This graph shows the year-over-year change for these four key measures of inflation. On a year-over-year basis, the median CPI rose 2.1%, the trimmed-mean CPI rose 1.9%, and the CPI less food and energy rose 1.7%. Core PCE is for June and increased 1.5% year-over-year.
On a monthly basis, median CPI was at 2.0% annualized, trimmed-mean CPI was at 1.8% annualized, and core CPI was at 1.4% annualized.
Using these measures, inflation was soft again in July. Overall these measures are mostly below the Fed's 2% target (Median CPI is slightly above).
Early Look at 2018 Cost-Of-Living Adjustments and Maximum Contribution Base
by Calculated Risk on 8/11/2017 09:31:00 AM
The BLS reported this morning:
The Consumer Price Index for Urban Wage Earners and Clerical Workers (CPI-W) increased 1.6 percent over the last 12 months to an index level of 238.617 (1982-84=100). For the month, the index decreased 0.1 percent prior to seasonal adjustment.CPI-W is the index that is used to calculate the Cost-Of-Living Adjustments (COLA). The calculation dates have changed over time (see Cost-of-Living Adjustments), but the current calculation uses the average CPI-W for the three months in Q3 (July, August, September) and compares to the average for the highest previous average of Q3 months. Note: this is not the headline CPI-U, and is not seasonally adjusted (NSA).
• In 2016, the Q3 average of CPI-W was 235.057.
The 2016 Q3 average was the highest Q3 average, so we only have to compare Q3 this year to last year. (Sometimes we have to look back two years).
 Click on graph for larger image.
This graph shows CPI-W since January 2000. The red lines are the Q3 average of CPI-W for each year.
Note: The year labeled for the calculation, and the adjustment is effective for December of that year (received by beneficiaries in January of the following year).
CPI-W was up 1.6% year-over-year in July, and although this is early - we still need the data for August and September - it appears COLA will be positive this year, and will probably be around 1% to 2% this year.
Contribution and Benefit Base
The law prohibits an increase in the contribution and benefit base if COLA is not greater than zero. However if the there is even a small increase in COLA (seems likely this year), the contribution base will be adjusted using the National Average Wage Index.
From Social Security: Cost-of-Living Adjustment Must Be Greater Than Zero
... ... any amount that is directly dependent for its value on the COLA would not increase. For example, the maximum Supplemental Security Income (SSI) payment amounts would not increase if there were no COLA.The contribution base will be adjusted using the National Average Wage Index. This is based on a one year lag. The National Average Wage Index is not available for 2016 yet, but wages probably increased again in 2016. If wages increased the same as last year, then the contribution base next year will increase to around $131,500 from the current $127,200.
... if there were no COLA, section 230(a) of the Social Security Act prohibits an increase in the contribution and benefit base (Social Security's maximum taxable earnings), which normally increases with increases in the national average wage index. Similarly, the retirement test exempt amounts would not increase ...
Remember - this is an early look. What matters is average CPI-W for all three months in Q3 (July, August and September).
BLS: CPI increased 0.1% in July, Core CPI increased 0.1%
by Calculated Risk on 8/11/2017 08:32:00 AM
The Consumer Price Index for All Urban Consumers (CPI-U) rose 0.1 percent in July on a seasonally adjusted basis, the U.S. Bureau of Labor Statistics reported today. Over the last 12 months, the all items index rose 1.7 percent.I'll post a graph later today after the Cleveland Fed releases the median and trimmed-mean CPI. This was below the consensus forecast of a 0.2% increase for CPI, and above the forecast of a 0.2% increase in core CPI.
...
The index for all items less food and energy rose 0.1 percent, the fourth month in a row it increased by that amount. ... The index for all items less food and energy also rose 1.7 percent for the 12 month period, the same increase as for the 12 months ending May and June.
emphasis added
Thursday, August 10, 2017
Friday: CPI
by Calculated Risk on 8/10/2017 05:59:00 PM
From Professor Krugman: How Bad Will It Be If We Hit The Debt Ceiling?
[I]t looks fairly likely that by October or so there will come a day when the U.S. government stops paying some of its bills, including interest on debt.CR Note: My guess is the U.S. government will pay their bills, but you never know. (For more, see Goldman on the "Debt Limit").
How bad will that be? The truth is that we don’t know ...
...
Suppose that everyone expected normal payments to resume, with back interest, in a couple of weeks. In that case, even a slight discount on, say, Treasury bills would make them a very good investment — so speculators would basically step in and support the value of U.S. debt despite temporary default. In that case default might not be that big a deal.
The big problem would come if investors see the default as more than a temporary glitch — if they see it as a sign of enduring, critical dysfunction in American governance. In that case they wouldn’t necessarily step in to buy our debt, and their confidence in the whole economic edifice would take a severe hit.
Friday:
• At 8:30 AM ET, The Consumer Price Index for July from the BLS. The consensus is for a 0.2% increase in CPI, and a 0.2% increase in core CPI.
Hotels: Occupancy Rate Down Year-over-Year
by Calculated Risk on 8/10/2017 03:33:00 PM
From HotelNewsNow.com: STR: US hotel results for week ending 5 August
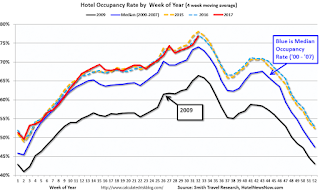
The U.S. hotel industry reported mostly negative year-over-year results in the three key performance metrics during the week of 30 July through 5 August 2017, according to data from STR.The following graph shows the seasonal pattern for the hotel occupancy rate using the four week average.
In comparison with the week of 31 July through 6 August 2016, the industry recorded the following:
• Occupancy: -1.5% to 74.5%
• Average daily rate (ADR): +0.7% to US$129.00
• Revenue per available room (RevPAR): -0.8% to US$96.08
emphasis added
 The red line is for 2017, dash light blue is 2016, dashed orange is 2015 (best year on record), blue is the median, and black is for 2009 (the worst year since the Great Depression for hotels).
Currently the occupancy rate is tracking close to last year, and behind the record year in 2015.
Seasonally, the occupancy rate will remain strong over the next few weeks and then decline into the Fall.
Data Source: STR, Courtesy of HotelNewsNow.com
Fannie and Freddie: REO inventory declined in Q2, Down 30% Year-over-year
by Calculated Risk on 8/10/2017 11:33:00 AM
Fannie and Freddie reported results last week. Here is some information on Real Estate Owned (REOs).
Freddie Mac reported the number of REO declined to 9,915 at the end of Q2 2017 compared to 13,284 at the end of Q2 2016.
For Freddie, this is down 87% from the 74,897 peak number of REOs in Q3 2010. For Freddie, this is the lowest since at least 2007.
Fannie Mae reported the number of REO declined to 31,371 at the end of Q2 2017 compared to 45,981 at the end of Q2 2016.
For Fannie, this is down 81% from the 166,787 peak number of REOs in Q3 2010. For Fannie, this is the lowest since at least 2007.

Here is a graph of Fannie and Freddie Real Estate Owned (REO).
REO inventory decreased in Q2 for both Fannie and Freddie, and combined inventory is down 30% year-over-year.
There are still a number of properties in the foreclosure process with long time lines in judicial foreclosure states - but this is close to normal levels of REOs.
Weekly Initial Unemployment Claims increase to 244,000
by Calculated Risk on 8/10/2017 08:33:00 AM
The DOL reported:
In the week ending August 5, the advance figure for seasonally adjusted initial claims was 244,000, an increase of 3,000 from the previous week's revised level. The previous week's level was revised up by 1,000 from 240,000 to 241,000. The 4-week moving average was 241,000, a decrease of 1,000 from the previous week's revised average. The previous week's average was revised up by 250 from 241,750 to 242,000.The previous week was revised up.
emphasis added
The following graph shows the 4-week moving average of weekly claims since 1971.
 Click on graph for larger image.
The dashed line on the graph is the current 4-week average. The four-week average of weekly unemployment claims decreased to 241,000.
This was higher than the consensus forecast.
The low level of claims suggests relatively few layoffs.
Wednesday, August 09, 2017
Thursday: Unemployment Claims, PPI
by Calculated Risk on 8/09/2017 06:38:00 PM
From Matthew Graham at Mortgage News Daily: New 2017 Lows for Rates, But There's a Catch
Mortgage rates fell to new lows for the year today, following the North Korea nuclear threat headlines. In truth, the preceding sentence gives too much credit to geopolitical risk. Rates were already drifting very close to the lowest levels since the election, even before yesterday's news broke. Additionally, the improvements are still too small to be translating to NOTE rates themselves (the actual interest rate applied to your loan balance). Instead, it's the upfront costs that are allowing for fine-tuning adjustments. (This means the EFFECTIVE rate is changing, but not the NOTE rate.) [30YR FIXED - 4.00%]Thursday:
• At 8:30 AM ET, The initial weekly unemployment claims report will be released. The consensus is for 241 thousand initial claims, up from 240 thousand the previous week.
• Also at 8:30 AM, The Producer Price Index for July from the BLS. The consensus is a 0.1% increase in PPI, and a 0.2% increase in core PPI.


