by Calculated Risk on 1/26/2017 11:00:00 AM
Thursday, January 26, 2017
Kansas City Fed: Regional Manufacturing Activity "Continued to Expand Moderately" in January
From the Kansas City Fed: Tenth District Manufacturing Activity Continued to Expand Moderately
The Federal Reserve Bank of Kansas City released the January Manufacturing Survey today. According to Chad Wilkerson, vice president and economist at the Federal Reserve Bank of Kansas City, the survey revealed that Tenth District manufacturing activity continued to expand moderately with strong expectations for future activity.The Kansas City region was hit hard by the decline in oil prices, but activity is expanding again.
“We had another solid composite index reading in January, and firms’ expectations for future activity were the highest in more than twelve years,” said Wilkerson.
...
The month-over-month composite index was 9 in January, unchanged from 9 in December but up from 0 in November. The composite index is an average of the production, new orders, employment, supplier delivery time, and raw materials inventory indexes. Activity in durable goods plants increased moderately, particularly for metals, electronics, and machinery, while nondurable goods plants expanded at a slower pace with food production falling considerably. Most month-over-month indexes improved slightly in January. The production index moved slightly higher from 18 to 20, and the shipments, new orders, and order backlog indexes also increased. The employment index moderated somewhat from 8 to 6, and the new orders for exports index remained negative. ...
emphasis added
New Home Sales decrease to 536,000 Annual Rate in December
by Calculated Risk on 1/26/2017 10:12:00 AM
The Census Bureau reports New Home Sales in December were at a seasonally adjusted annual rate (SAAR) of 536 thousand.
The previous three months were revised up combined.
"Sales of new single-family houses in December 2016 were at a seasonally adjusted annual rate of 536,000, according to estimates released jointly today by the U.S. Census Bureau and the Department of Housing and Urban Development. This is 10.4 percent below the revised November rate of 598,000 and is 0.4 percent below the December 2015 estimate of 538,000.
An estimated 563,000 new homes were sold in 2016. This is 12.2 percent above the 2015 figure of 501,000."
emphasis added
 Click on graph for larger image.
The first graph shows New Home Sales vs. recessions since 1963. The dashed line is the current sales rate.
Even with the increase in sales over the last several years, new home sales are still fairly low historically.
The second graph shows New Home Months of Supply.
 The months of supply increased in December to 5.8 months.
 The all time record was 12.1 months of supply in January 2009.
This is now in the normal range (less than 6 months supply is normal).
" The seasonally adjusted estimate of new houses for sale at the end of December was 259,000. This represents a supply of 5.8 months at the current sales rate."
 On inventory, according to the Census Bureau:
 "A house is considered for sale when a permit to build has been issued in permit-issuing places or work has begun on the footings or foundation in nonpermit areas and a sales contract has not been signed nor a deposit accepted."Starting in 1973 the Census Bureau broke this down into three categories: Not Started, Under Construction, and Completed.
The third graph shows the three categories of inventory starting in 1973.
The inventory of completed homes for sale is still low, and the combined total of completed and under construction is also low.
 The last graph shows sales NSA (monthly sales, not seasonally adjusted annual rate).
In December 2016 (red column), 38 thousand new homes were sold (NSA). Last year, 38 thousand homes were also sold in December.
The all time high for December was 87 thousand in 2005, and the all time low for December was 23 thousand in 1966 and 2010.
This was well below expectations of 590,000 sales SAAR. I'll have more later today.
Weekly Initial Unemployment Claims increase to 259,000
by Calculated Risk on 1/26/2017 08:37:00 AM
The DOL reported:
In the week ending January 21, the advance figure for seasonally adjusted initial claims was 259,000, an increase of 22,000 from the previous week's revised level. The previous week's level was revised up by 3,000 from 234,000 to 237,000. The 4-week moving average was 245,500, a decrease of 2,000 from the previous week's revised average. This is the lowest level for this average since November 3, 1973 when it was 244,000. The previous week's average was revised up by 750 from 246,750 to 247,500.The previous week was revised up.
emphasis added
The following graph shows the 4-week moving average of weekly claims since 1971.
 Click on graph for larger image.
The dashed line on the graph is the current 4-week average. The four-week average of weekly unemployment claims decreased to 245,500.
This was above the consensus forecast. This is the lowest level for the four week average since 1973 (with a much larger population today).
The low level of claims suggests relatively few layoffs.
Wednesday, January 25, 2017
Thursday: New Home Sales, Unemployment Claims
by Calculated Risk on 1/25/2017 04:51:00 PM
From Matthew Graham at Mortgage News Daily: Mortgage Rates Resume Big-Picture Uptrend
Mortgage rates moved higher for the 5th time in the past 6 business days. The past 2 days have combined to bring rates a full .125% higher. That's the increment by which rates are most commonly divided (i.e. 4.0, 4.125%, 4.25%, etc.). ... The average lender is once-again quoting 4.25% on top tier conventional 30yr fixed scenarios. This isn't the first time we've seen 4.25% this year, but closing costs are slightly higher today. That means effective rates are at 2017 highs. Several lenders are already up to 4.375% and a scant few remain at 4.125%.Thursday:
emphasis added
• At 8:30 AM ET, The initial weekly unemployment claims report will be released. The consensus is for 247 thousand initial claims, up from 234 thousand the previous week.
• Also at 8:30 AM, Chicago Fed National Activity Index for December. This is a composite index of other data.
• At 10:00 AM, New Home Sales for December from the Census Bureau. The consensus is for a decrease in sales to 590 thousand Seasonally Adjusted Annual Rate (SAAR) in December from 592 thousand in November.
• At 11:00 AM, the Kansas City Fed manufacturing survey for January.
Vehicle Sales Forecast: Sales Around 17 Million SAAR in January
by Calculated Risk on 1/25/2017 12:49:00 PM
The automakers will report January vehicle sales on Wednesday, February 1st.
Note: There were 24 selling days in January 2017, unchanged from 24 in January 2016.
From WardsAuto: Forecast: January Forecast Calls for Low Sales, High Inventory
The U.S. automotive industry is expected to a have a slow start in the new year, with January light-vehicle sales down 4.4% from like-2016. ... The resulting seasonally adjusted annual rate is 17.0 million units, well below the 18.3 million in the previous month and 17.4 million year-ago.Here is a table (source: BEA) showing the top 10 years for light vehicle sales.
...
December inventory was 9.2% above same-month 2015, the biggest year-over-year gap since the summer of 2014. Weak sales in January will keep inventory levels high, 16.0% greater than year-ago. A 93-day supply is expected to be available at the end of the month, a major jump from 62 days in December and 77 in January 2016.
emphasis added
2016 was the best ever, and 2017 will probably be mostly flat (no growth) compared to 2016. With high inventories, production in 2017 will probably decline - even with solid sales.
| Light Vehicle Sales, Top 10 Years | ||||
|---|---|---|---|---|
| Year | Sales (000s) | |||
| 1 | 2016 | 17,465 | ||
| 2 | 2015 | 17,396 | ||
| 3 | 2000 | 17,350 | ||
| 4 | 2001 | 17,122 | ||
| 5 | 2005 | 16,948 | ||
| 6 | 1999 | 16,894 | ||
| 7 | 2004 | 16,867 | ||
| 8 | 2002 | 16,816 | ||
| 9 | 2003 | 16,639 | ||
| 10 | 2006 | 16,504 | ||
Goldman Sachs FOMC Preview
by Calculated Risk on 1/25/2017 10:26:00 AM
A few excerpts from a note by Goldman Sachs economists Zach Pandl and Jan Hatzius: FOMC Preview: Holding Pattern
The FOMC looks very likely to keep policy unchanged next week, and should make only modest revisions to the post-meeting statement.CR note: The FOMC meeting is scheduled next week for Tuesday, January 31st and Wednesday, February 1st. The consensus is there will be no change in policy at this meeting.
We expect constructive comments on economic activity, assuming GDP growth for Q4 (reported this Friday) is in line with or better than our +2.2% forecast. The committee will probably keep its description of inflation trends roughly unchanged, but it may acknowledge that headline PCE inflation should reach 2% relatively soon (instead of “over the medium term”).
We look for the balance of risk assessment and the characterization of current policy (“accommodative”) to remain unchanged. The statement will likely leave out any explicit mention of fiscal policy for the time being.
MBA: Mortgage Applications Increase in Latest Weekly Survey
by Calculated Risk on 1/25/2017 07:00:00 AM
From the MBA: Mortgage Applications Increase in Latest MBA Weekly Surve
Mortgage applications increased 4.0 percent from one week earlier, according to data from the Mortgage Bankers Association’s (MBA) Weekly Mortgage Applications Survey for the week ending January 20, 2017. This week’s results included an adjustment for the MLK Day holiday.
... The Refinance Index increased 0.2 percent from the previous week. The seasonally adjusted Purchase Index increased 6 percent from one week earlier to its highest level since June 2016. The unadjusted Purchase Index increased 2 percent compared with the previous week and was 0.1 percent higher than the same week one year ago.
...
The average contract interest rate for 30-year fixed-rate mortgages with conforming loan balances ($424,000 or less) increased to 4.35 percent from 4.27 percent, with points decreasing to 0.30 from 0.39 (including the origination fee) for 80 percent loan-to-value ratio (LTV) loans.
emphasis added
 Click on graph for larger image.
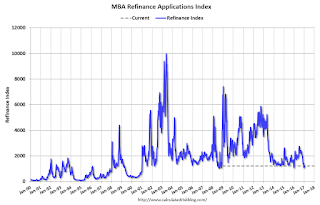
The first graph shows the refinance index since 1990.
It would take a substantial decrease in mortgage rates to see a significant increase in refinance activity - although we might see more cash-out refis.
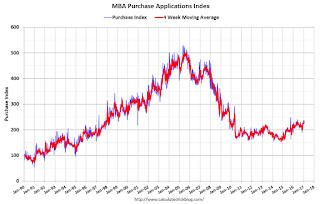
 The second graph shows the MBA mortgage purchase index.
 Even with the increase in mortgage rates, purchase activity is still holding up - this is the highest level for the index since June 2016.
However refinance activity has declined significantly.
Tuesday, January 24, 2017
Chemical Activity Barometer "Starts New Year with Strong Gain"
by Calculated Risk on 1/24/2017 03:44:00 PM
Note: This appears to be a leading indicator for industrial production.
From the American Chemistry Council: Chemical Activity Barometer Starts New Year with Strong Gain
The Chemical Activity Barometer (CAB), a leading economic indicator created by the American Chemistry Council (ACC), started the year on a strong note, posting a monthly gain of 0.4 percent in January. This follows a 0.3 percent gain in December, November and October. All data is measured on a three-month moving average (3MMA). Accounting for adjustments, the CAB was up 4.6 percent over this time last year.
...
In January all of the four core categories for the CAB improved and the diffusion index was stable at 65 percent. Production-related indicators were positive, with the housing report indicating accelerating activity and trends in construction-related resins, pigments and related performance chemistry generally improved. Other indicators, including equity prices, product prices, and inventory were also positive.
...
Applying the CAB back to 1912, it has been shown to provide a lead of two to fourteen months, with an average lead of eight months at cycle peaks as determined by the National Bureau of Economic Research. The median lead was also eight months. At business cycle troughs, the CAB leads by one to seven months, with an average lead of four months. The median lead was three months. The CAB is rebased to the average lead (in months) of an average 100 in the base year (the year 2012 was used) of a reference time series. The latter is the Federal Reserve’s Industrial Production Index.
emphasis added
 Click on graph for larger image.
This graph shows the year-over-year change in the 3-month moving average for the Chemical Activity Barometer compared to Industrial Production. It does appear that CAB (red) generally leads Industrial Production (blue).
CAB has increased solidly over the last several months, and this suggests an increase in Industrial Production over the next year.
BLS: Unemployment Rates Lower in 10 states, Stable in 39 states in December
by Calculated Risk on 1/24/2017 01:15:00 PM
From the BLS: Regional and State Employment and Unemployment Summary
Unemployment rates were significantly lower in December in 10 states, higher in 1 state, and stable in 39 states and the District of Columbia, the U.S. Bureau of Labor Statistics reported today. Eleven states had notable jobless rate decreases from a year earlier, 2 states had increases, and 37 states and the District had no significant change. The national unemployment rate, 4.7 percent, was little changed from November but 0.3 percentage point lower than in December 2015.
...
New Hampshire had the lowest unemployment rate in December, 2.6 percent, followed by Massachusetts and South Dakota, 2.8 percent each. Alaska and New Mexico had the highest jobless rates, 6.7 percent and 6.6 percent, respectively.
emphasis added
 Click on graph for larger image.
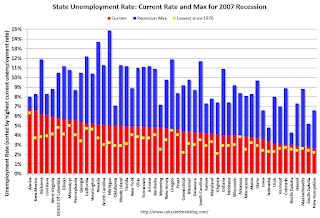
This graph shows the current unemployment rate for each state (red), and the max during the recession (blue). All states are well below the maximum unemployment rate for the recession.
The size of the blue bar indicates the amount of improvement. The yellow squares are the lowest unemployment rate per state since 1976.
The states are ranked by the highest current unemployment rate. Alaska, at 6.7%, had the highest state unemployment rate. Note that the lowest recorded unemployment rate in Alaska was 6.3%, so this is pretty close to the all time low.
 The second graph shows the number of states (and D.C.) with unemployment rates at or above certain levels since January 2006. At the worst of the employment recession, there were 11 states with an unemployment rate at or above 11% (red).
Currently no state has an unemployment rate at or above 7% (light blue); Only four states are at or above 6% (dark blue). The states are Alaska (6.7%), New Mexico (6.6%), Alabama (6.2%), and Louisiana (6.1%).
A Few Comments on December Existing Home Sales
by Calculated Risk on 1/24/2017 11:36:00 AM
Earlier: NAR: "Existing-Home Sales Slide in December; 2016 Sales Best Since 2006"
Two key points:
1) Many of these December existing home sales were already in escrow - with mortgage rates locked - before the recent increase in mortgage rates (rates started increasing after the election).
With the recent increase in rates, I'd expect some decline in sales volume as happened following the "taper tantrum" in 2013. So we might see sales fall to 5 million SAAR or below over the next 6 months. That would still be solid existing home sales. We might also see a little more inventory in the coming months, and therefore less price appreciation.
Usually a change in interest rates impacts new home sales first, because new home sales are reported when the contract is signed, whereas existing home sales are reported when the contract closes. So we might see some impact on new home sales for December.
2) Inventory is still very low and falling year-over-year (down 6.3% year-over-year in December). More inventory would probably mean smaller price increases and slightly higher sales, and less inventory means lower sales and somewhat larger price increases.
Two of the key reasons inventory is low: 1) A large number of single family home and condos were converted to rental units. In 2015, housing economist Tom Lawler estimated there were 17.5 million renter occupied single family homes in the U.S., up from 10.7 million in 2000. Many of these houses were purchased by investors, and rents have increased substantially, and the investors are not selling (even though prices have increased too). Most of these rental conversions were at the lower end, and that is limiting the supply for first time buyers. 2) Baby boomers are aging in place (people tend to downsize when they are 75 or 80, in another 10 to 20 years for the boomers). Instead we are seeing a surge in home improvement spending, and this is also limiting supply.
Of course low inventory keeps potential move-up buyers from selling too. If someone looks around for another home, and inventory is lean, they may decide to just stay and upgrade.
I've heard reports of more inventory in some coastal areas of California, in New York city and for high rise condos in Miami. But we haven't seen a change in trend for inventory yet.
The following graph shows existing home sales Not Seasonally Adjusted (NSA).

Sales NSA in December (red column) were the highest for December since 2006 (NSA).
Note that sales NSA are in the slower seasonal period, and will really slow seasonally in January and February.


