 RSS Feed
 by Calculated Risk on 10/31/2016 08:36:00 AM
Monday, October 31, 2016
Personal Income increased 0.3% in September, Spending increased 0.5%
The BEA released the Personal Income and Outlays report for September:
Personal income increased $46.7 billion (0.3 percent) in September according to estimates released today by the Bureau of Economic Analysis ... Personal consumption expenditures (PCE) increased $61.0 billion (0.5 percent).On inflation: The PCE price index increased 1.2 percent year-over-year due to the sharp decline in oil prices (This was up from 1.0% year-over-year in August). The core PCE price index (excluding food and energy) increased 1.7 percent year-over-year in September (the same as in August).
...
Real PCE increased 0.3 percent. The PCE price index increased 0.2 percent. Excluding food and energy, the PCE price index increased 0.1 percent.
Sunday, October 30, 2016
Sunday Night Futures: Gasoline Prices up Slightly Year-over-year
by Calculated Risk on 10/30/2016 06:24:00 PM
Weekend:
• Schedule for Week of Oct 30, 2016
• "How do I protect myself if Trump is elected?"
Monday:
• At 8:30 AM ET, Personal Income and Outlays for September. The consensus is for a 0.4% increase in personal income, and for a 0.5% increase in personal spending. And for the Core PCE price index to increase 0.1%.
• At 9:45 AM, the Chicago Purchasing Managers Index for October. The consensus is for a reading of 54.3, up from 54.2 in September.
• At 10:30 AM, the Dallas Fed Survey of Manufacturing Activity for October. This is the last of the regional Fed surveys for October.
From CNBC: Pre-Market Data and Bloomberg futures: S&P futures and DOW futures are down slightly (fair value).
Oil prices were down over the last week with WTI futures at $48.70 per barrel and Brent at $49.71 per barrel. A year ago, WTI was at $47, and Brent was at $48 - so oil prices are UP slightly year-over-year.
Here is a graph from Gasbuddy.com for nationwide gasoline prices. Nationally prices are at $2.20 per gallon - a year ago prices were $2.18 per gallon - so gasoline prices are up slightly year-over-year.
"How do I protect myself if Trump is elected?"
by Calculated Risk on 10/30/2016 12:01:00 PM
Quite a few readers have asked me this question. My usual answer is that I expect Ms. Clinton to be elected President, and that the expansion will continue.
I've spoken to several key analysts and economists, and for their forecasts, all are assuming Ms. Clinton will be the next President (my forecasts also assume a Clinton presidency). So if Trump is elected, expect some market volatility as forecasts are changed. As Merrill Lynch recently noted:
"As our strategists have noted, the initial reaction to a potential Trump victory would likely be a risk-off event in the markets, which we think could end up delaying the Fed from hiking in December."That is just a guess at the short term reaction. The general rule is don't invest based on your political views.
However policy does matter for investing and the economy. As an example, it was obvious to invest in oil when George W. Bush became President. And insurance companies like United Healthcare and Aetna seemed like good bets with a President Obama.
Another example of policy is the deregulation of banks (and the anti-regulation attitude of the Bush administration) as part of the housing bubble story.
But what about with Mr. Trump? He has said he'd "build a wall" along the border with Mexico, renegotiate all trade deals, cut taxes on high income earners, repeal Obamacare and more. But it is unclear what he'd actually do as President. As an example, no one really thinks a wall will be built along the entire border (maybe sections of a wall - and Mexico wouldn't pay for it).
Repealing the ACA - without a replacement - would lead to many millions of Americans without health insurance. And those with preexisting conditions would be uninsurable. This seems politically unlikely (without a replacement policy), but if it happens, sell those health insurance companies.
Right now it is hard to guess what policy would look like with Mr. Trump (Trump doesn't seem to understand policy issues - like his ignorant comments on the VAT while talking about trade with Mexico). One key concern with Trump is the potential for a trade war - and that could happen almost without warning.
Long time readers remember when I used to write about the impact of policy (both good and bad), but there hasn't been much policy to discuss for the last few years. If Trump is elected, I'd expect a GOP sweep, and then I'll be writing frequently about policy again. Since Trump is at war with the data (he rejects data that doesn't fit his views), I don't expect evidence based policy proposals - and that almost always means bad results.
Until we see the actual policy proposals, it is hard to predict the impact. I will not predict a recession just because Trump is elected, but I do think the economy would perform better under Clinton than Trump.
Also, the words of a President matter. Mr Trump has been reckless and irresponsible with his comments, and that would probably continue. One absurd comment could send the markets into a tailspin (and that could happen at any time). That should make investors more cautious (as an example, I'm recommending that my home builder friends ease back on their spec building if Trump is elected).
In conclusion: I expect Ms. Clinton to be elected and I'm currently taking no action to protect myself against the risks of a Trump presidency. The risks are real, but I think the odds of Trump winning are very low. If the unimaginable happens, I'll be writing about when to head to the bunker.
Saturday, October 29, 2016
October 2016: Unofficial Problem Bank list declines to 173 Institutions
by Calculated Risk on 10/29/2016 02:45:00 PM
This is an unofficial list of Problem Banks compiled only from public sources.
Here is the unofficial problem bank list for October 2016.
Changes and comments from surferdude808:
Update on the Unofficial Problem Bank List for October 2016. During the month, the list fell from 177 institutions to 173 after five removals and one addition. Assets dropped by $562 million to an aggregate $54.9 billion. A year ago, the list held 264 institutions with assets of $79.2 billion.
Actions have been terminated against Horry County State Bank, Loris, SC ($383 million Ticker: HCFB) and Heritage Community Bank, Greeneville, TN ($89 million). Finding merger partners were Landmark Community Bank, National Association, Isanti, MN ($80 million); Citizens State Bank, Kingsland, GA ($56 million); and Home Savings Bank, Jefferson City, MO ($24 million). Added this month was The First National Bank of Lacon, Lacon, IL ($70 million).
In a change, the OCC released an update on its enforcement action activity today, the last Friday of the month. Historically, the OCC has issued its update on the first Friday following the 15th of the month. While the FDIC provides a release on the last Friday of the month as well; however, it only includes action changes for the preceding month, so their information has a longer lag time. Conversely, the Federal Reserve releases individual action changes as they occur instead of waiting to accumulate them in a monthly release.
Schedule for Week of Oct 30, 2016
by Calculated Risk on 10/29/2016 08:12:00 AM
The key report this week is the October employment report on Friday.
Other key indicators include the October ISM manufacturing and non-manufacturing indexes, October auto sales, and the September trade deficit.
The FOMC meets on Tuesday and Wednesday, and no change to policy is expected.
8:30 AM ET: Personal Income and Outlays for September. The consensus is for a 0.4% increase in personal income, and for a 0.5% increase in personal spending. And for the Core PCE price index to increase 0.1%.
9:45 AM: Chicago Purchasing Managers Index for October. The consensus is for a reading of 54.3, up from 54.2 in September.
10:30 AM: Dallas Fed Survey of Manufacturing Activity for October. This is the last of the regional Fed surveys for October.
 10:00 AM: ISM Manufacturing Index for October. The consensus is for the ISM to be at 51.6, up from 51.5 in September.
Here is a long term graph of the ISM manufacturing index.
The ISM manufacturing index indicated expansion at 51.5% in September. The employment index was at 49.7%, and the new orders index was at 55.1%.
10:00 AM: Construction Spending for September. The consensus is for a 0.6% increase in construction spending.
 All day: Light vehicle sales for October. The consensus is for light vehicle sales to decrease to 17.6 million SAAR in October, from 17.7 million in September (Seasonally Adjusted Annual Rate).
This graph shows light vehicle sales since the BEA started keeping data in 1967. The dashed line is the September sales rate.
7:00 AM ET: The Mortgage Bankers Association (MBA) will release the results for the mortgage purchase applications index.
8:15 AM: The ADP Employment Report for October. This report is for private payrolls only (no government). The consensus is for 170,000 payroll jobs added in October, up from 154,000 added in September.
2:00 PM: FOMC Meeting Announcement. No change to policy is expected at this meeting.
8:30 AM ET: The initial weekly unemployment claims report will be released. The consensus is for 255 thousand initial claims, down from 258 thousand the previous week.
10:00 AM: Manufacturers' Shipments, Inventories and Orders (Factory Orders) for September. The consensus is a 0.2% increase in orders.
10:00 AM: the ISM non-Manufacturing Index for October. The consensus is for index to decrease to 56.1 from 57.1 in August.
8:30 AM: Employment Report for October. The consensus is for an increase of 178,000 non-farm payroll jobs added in October, up from the 156,000 non-farm payroll jobs added in September.
The consensus is for the unemployment rate to decline to 4.9%.
 This graph shows the year-over-year change in total non-farm employment since 1968.
In September, the year-over-year change was 2.45 million jobs.
A key will be the change in wages.
 8:30 AM: Trade Balance report for September from the Census Bureau.
 This graph shows the U.S. trade deficit, with and without petroleum, through July. The blue line is the total deficit, and the black line is the petroleum deficit, and the red line is the trade deficit ex-petroleum products.
The consensus is for the U.S. trade deficit to be at $38.9 billion in September from $40.7 billion in August.
Friday, October 28, 2016
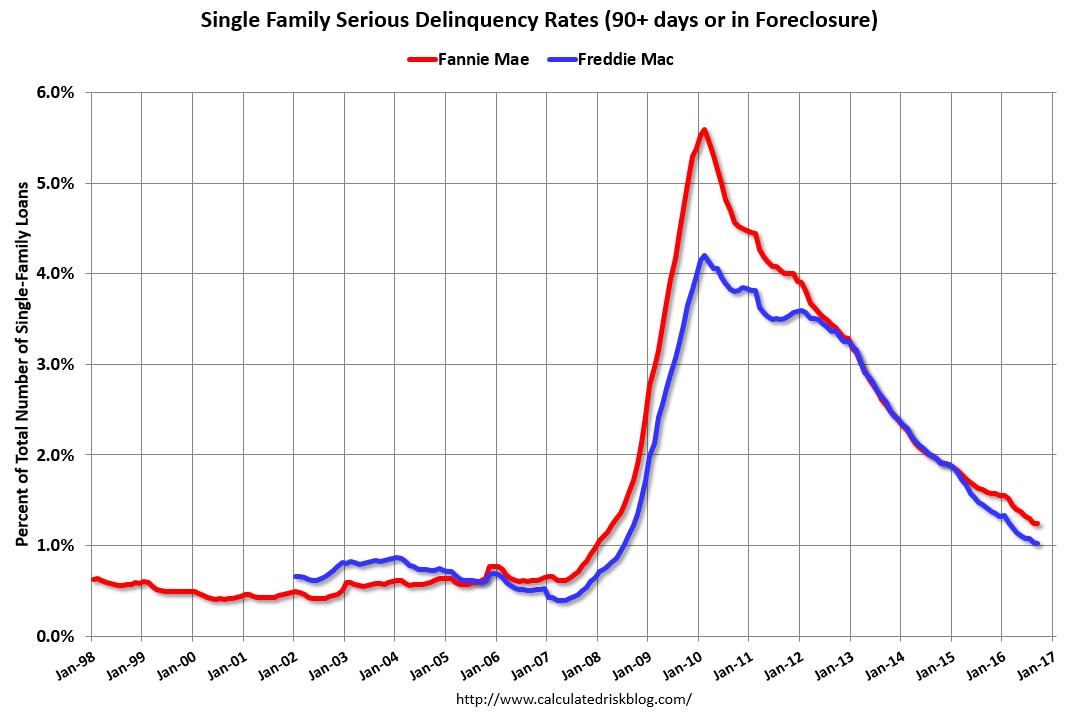
Fannie Mae: Mortgage Serious Delinquency rate unchanged in September
by Calculated Risk on 10/28/2016 05:04:00 PM
Fannie Mae reported today that the Single-Family Serious Delinquency rate was at 1.24% in September, unchanged from 1.24% in August. The serious delinquency rate is down from 1.59% in September 2015.
These are mortgage loans that are "three monthly payments or more past due or in foreclosure".
The Fannie Mae serious delinquency rate peaked in February 2010 at 5.59%.
 Click on graph for larger image
Although the rate is generally declining, the "normal" serious delinquency rate is under 1%.
The Fannie Mae serious delinquency rate has fallen 0.35 percentage points over the last year, and at that rate of improvement, the serious delinquency rate will not be below 1% for about 8 more months.
Note: Freddie Mac reported yesterday.
Q3 GDP: Investment
by Calculated Risk on 10/28/2016 02:05:00 PM
The graph below shows the contribution to GDP from residential investment, equipment and software, and nonresidential structures (3 quarter trailing average). This is important to follow because residential investment tends to lead the economy, equipment and software is generally coincident, and nonresidential structure investment trails the economy.
In the graph, red is residential, green is equipment and software, and blue is investment in non-residential structures. So the usual pattern - both into and out of recessions is - red, green, blue.
The dashed gray line is the contribution from the change in private inventories.
 Click on graph for larger image.
Residential investment (RI) decreased at a 6.2% annual rate in Q3. Equipment investment decreased at a 2.7% annual rate, and investment in non-residential structures increased at a 5.4% annual rate.
On a 3 quarter trailing average basis, RI (red) is unchanged, equipment (green) is slightly negative, and nonresidential structures (blue) is slightly positive.
I'll post more on the components of non-residential investment once the supplemental data is released.
I expect investment to pick up going forward, and for the economy to grow at a steady pace.

The second graph shows residential investment as a percent of GDP.
Residential Investment as a percent of GDP has generally been increasing, but is only just above the bottom of the previous recessions - and I expect RI to continue to increase for the next few years.
I'll break down Residential Investment into components after the GDP details are released.
Note: Residential investment (RI) includes new single family structures, multifamily structures, home improvement, broker's commissions, and a few minor categories.
 The third graph shows non-residential investment in structures, equipment and "intellectual property products". Investment in equipment - as a percent of GDP - has declined a little recently.. Investment in nonresidential structures - as a percent of GDP - had been moving down due to less investment in energy and power, and is now moving sideways.
Still no worries - residential investment will pickup (still very low), and non-residential will also pickup.
Goldman: FOMC Preview
by Calculated Risk on 10/28/2016 11:11:00 AM
A few excerpts from a piece by Goldman Sachs economists Zach Pandl and Jan Hatzius
• We expect the statement following next week’s FOMC meeting to remain relatively upbeat about US growth prospects ... However, the committee is very unlikely to raise the funds rate. ...CR note: The next FOMC meeting is next week, on November 1st and 2nd and it seems very unlikely there will be a change in policy at this meeting.
• To keep markets on notice for a possible rate hike in December, we expect the statement to indicate that the committee is considering action “at its next meeting”—although this is a close call. The statement will likely again say that risks to the economic outlook are “roughly balanced”.
• A statement along these lines should keep the committee on track to raise the funds rate at the December meeting. We see a 75% chance of an increase, roughly in line with market expectations. The remaining uncertainty relates to incoming economic data and financial conditions ... conditional on decent data and stable markets, a December rate hike looks very likely.
October Consumer Sentiment declines to 87.2
by Calculated Risk on 10/28/2016 10:04:00 AM
The final University of Michigan consumer sentiment index for October was at 87.2, down from the preliminary estimate of 87.9, and down from 91.2 in September.
The Sentiment Index slipped in October to the same low recorded last September and to the lowest level since October 2014. The October decline was due to less favorable prospects for the national economy, with half of all consumers anticipating an economic downturn sometime in the next five years for the first time since October 2014. Objectively, the probability of a downturn during the next five years is far from zero-this would be the longest expansion in 150 years if it lasted just over half of the five year horizon. Nonetheless, the October rise may simply reflect a temporary bout of uncertainty caused by the election.
emphasis added

Click on graph for larger image.
BEA: Real GDP increased at 2.9% Annualized Rate in Q3
by Calculated Risk on 10/28/2016 08:34:00 AM
From the BEA: Gross Domestic Product: Third Quarter 2016 (Advance Estimate)
Real gross domestic product increased at an annual rate of 2.9 percent in the third quarter of 2016, according to the "advance" estimate released by the Bureau of Economic Analysis. In the second quarter, real GDP increased 1.4 percent.The advance Q1 GDP report, with 2.9% annualized growth, was above expectations of a 2.5% increase.
...
he increase in real GDP in the third quarter reflected positive contributions from personal consumption expenditures (PCE), exports, private inventory investment, federal government spending, and nonresidential fixed investment that were partly offset by negative contributions from residential fixed investment and state and local government spending. Imports, which are a subtraction in the calculation of GDP, increased.
The acceleration in real GDP growth in the third quarter reflected an upturn in private inventory investment, an acceleration in exports, a smaller decrease in state and local government spending, and an upturn in federal government spending. These were partly offset by a smaller increase in PCE, and a larger increase in imports.
emphasis added
Personal consumption expenditures (PCE) increased at a 2.1% annualized rate in Q3, down from 4.3% in Q2. Residential investment (RI) decreased at a 6.2% pace. Equipment investment decreased at a 2.7% annualized rate, and investment in non-residential structures increased at a 5.4% pace.
I'll have more later ...


