 RSS Feed
 by Calculated Risk on 10/06/2016 08:36:00 AM
Thursday, October 06, 2016
Weekly Initial Unemployment Claims decline to 249,000, 4-Week Average Lowest Since 1973
The DOL reported:
In the week ending October 1, the advance figure for seasonally adjusted initial claims was 249,000, a decrease of 5,000 from the previous week's unrevised level of 254,000. The 4-week moving average was 253,500, a decrease of 2,500 from the previous week's unrevised average of 256,000. This is the lowest level for this average since December 8, 1973 when it was 252,250.The previous week was unrevised.
There were no special factors impacting this week's initial claims. This marks 83 consecutive weeks of initial claims below 300,000, the longest streak since 1970.
The following graph shows the 4-week moving average of weekly claims since 1971.
 Click on graph for larger image.
The dashed line on the graph is the current 4-week average. The four-week average of weekly unemployment claims decreased to 253,500.
This was lower than the consensus forecast of 257,000. The low level of claims suggests relatively few layoffs.
Wednesday, October 05, 2016
Preview of September Employment Report
by Calculated Risk on 10/05/2016 03:45:00 PM
On Friday at 8:30 AM ET, the BLS will release the employment report for September. The consensus, according to Bloomberg, is for an increase of 168,000 non-farm payroll jobs in September (with a range of estimates between 155,000 to 200,000, and for the unemployment rate to be unchanged at 4.9%.
The BLS reported 151,000 jobs added in August.
Here is a summary of recent data:
• The ADP employment report showed an increase of 154,000 private sector payroll jobs in September. This was below expectations of 170,000 private sector payroll jobs added. The ADP report hasn't been very useful in predicting the BLS report for any one month, but in general, this suggests employment growth somewhat below expectations.
• The ISM manufacturing employment index increased in September to 49.7%. A historical correlation between the ISM manufacturing employment index and the BLS employment report for manufacturing, suggests that private sector BLS manufacturing payroll jobs decreased about 20,000 in September. The ADP report indicated 6,000 manufacturing jobs lost in September.
The ISM non-manufacturing employment index increased in September to 57.2%. A historical correlation between the ISM non-manufacturing employment index and the BLS employment report for non-manufacturing, suggests that private sector BLS non-manufacturing payroll jobs increased about 265,000 in September.
Combined, the ISM indexes suggests employment gains of about 245,000. This suggests employment growth well above expectations.
• Initial weekly unemployment claims averaged 256,000 in September, down from 263,000 in August. For the BLS reference week (includes the 12th of the month), initial claims were at 251,000, down from 261,000 during the reference week in August.
The decrease during the reference suggests fewer layoffs in September as compared to August. This suggests a positive employment report.
• The final September University of Michigan consumer sentiment index increased to 91.2 from the August reading of 89.8. Sentiment is frequently coincident with changes in the labor market, but there are other factors too like gasoline prices and possibly politics.
• Conclusion: Unfortunately none of the indicators alone is very good at predicting the initial BLS employment report. The ADP report would suggest a report weaker than the consensus, and the ISM reports, unemployment claims, consumer sentiment all suggest stronger job growth.
My guess is the September report will be above the consensus forecast.
Reis: Regional Mall Vacancy Rate decreased in Q3 2016, Strip Mall Vacancy Rate increased
by Calculated Risk on 10/05/2016 12:32:00 PM
Reis reported that the vacancy rate for regional malls decreased to 7.8% in Q3 2016, from 7.9% in Q2, and down from 7.9% in Q3 2015. This is down from a cycle peak of 9.4% in Q3 2011.
For Neighborhood and Community malls (strip malls), the vacancy rate increased to 10.0% in Q3 2016 from 9.9% in Q2, and was unchanged year-over-year from 10.0% in Q3 2015. For strip malls, the vacancy rate peaked at 11.1% in Q3 2011.
Comments from Reis Economist Barbara Byrne Denham :
The national vacancy rate for neighborhood and community shopping centers increased to 10.0% in the third quarter. In contrast to last quarter, net absorption fell short of new construction although overall occupancy did increase. The vacancy rate for malls declined to 7.8%. For the second straight quarter, the two retail subtypes see-sawed in opposite directions.
The retail industry has suffered from store closures across the U.S. Reis has been tracking store closures for the larger, more high-profile brands across the country. The Reis database includes 280 store closures in 59 of the 80 primary retail metros that Reis tracks totaling 12.8 million square feet of closed stores across the U.S. The major brands of stores include Walmart, Kohls, Sports Authority, Pathmark, Superfresh, A&P, Waldbaums, Haggen and Kmart. Many of these closures were concentrated in a handful of metro areas including Chicago, Central NJ, Northern NJ, Philadelphia, Long Island, San Diego and Los Angeles – all of which had more than 400,000 square feet of store closures from 2015 through July of this year.
That being said, regional malls have outperformed neighborhood and community centers throughout the recovery as the class A malls cater to wealthier consumers. Neighborhood and community centers have lagged due to the slow growth in median household income that has kept a lid on discretionary spending over the last few years. But recent job growth along with the 2015 median income report showing sharp increases across the U.S. suggest that retail fortunes may improve somewhat after trailing the other property classes over the last five years.
...
In short, the retail market faces greater challenges from structural changes than from cyclical issues. Both neighborhood and community centers and regional malls face competition from newer and fresher retail concepts as well as e-commerce. With job growth and gains in median family income across the U.S., the retail recovery should continue. Some properties will continue to outperform others just as some markets will outperform others. We continue to expect vacancy rates for neighborhood and community centers to slowly drift lower and rent growth to increase at a slightly faster rate. Rent growth should stay positive for malls as well, but we expect little change in vacancy rates. As we have mentioned, the gap between the winners and losers at the property level should continue to widen over time.
emphasis added
 Click on graph for larger image.
This graph shows the strip mall vacancy rate starting in 1980 (prior to 2000 the data is annual). The regional mall data starts in 2000. Back in the '80s, there was overbuilding in the mall sector even as the vacancy rate was rising. This was due to the very loose commercial lending that led to the S&L crisis.
In the mid-'00s, mall investment picked up as mall builders followed the "roof tops" of the residential boom (more loose lending). This led to the vacancy rate moving higher even before the recession started. Then there was a sharp increase in the vacancy rate during the recession and financial crisis.
Currently, both the strip mall and regional mall vacancy rates are mostly moving sideways at an elevated level.
Mall vacancy data courtesy of Reis.
ISM Non-Manufacturing Index increased sharply to 57.1% in September
by Calculated Risk on 10/05/2016 10:16:00 AM
The September ISM Non-manufacturing index was at 57.1%, up from 51.4% in August. The employment index increased in September to 57.2%, up from 50.7% in August. Note: Above 50 indicates expansion, below 50 contraction.
From the Institute for Supply Management:September 2016 Non-Manufacturing ISM Report On Business®
Economic activity in the non-manufacturing sector grew in September for the 80th consecutive month, say the nation's purchasing and supply executives in the latest Non-Manufacturing ISM® Report On Business®.
The report was issued today by Anthony Nieves, CPSM, C.P.M., CFPM, chair of the Institute for Supply Management® (ISM®) Non-Manufacturing Business Survey Committee. "The NMI® registered 57.1 percent in September, 5.7 percentage points higher than the August reading of 51.4 percent. This represents continued growth in the non-manufacturing sector at a faster rate. The Non-Manufacturing Business Activity Index increased substantially to 60.3 percent, 8.5 percentage points higher than the August reading of 51.8 percent, reflecting growth for the 86th consecutive month, at a noticeably faster rate in September. The New Orders Index registered 60 percent, 8.6 percentage points higher than the reading of 51.4 percent in August. The Employment Index increased 6.5 percentage points in September to 57.2 percent from the August reading of 50.7 percent. The Prices Index increased 2.2 percentage points from the August reading of 51.8 percent to 54 percent, indicating prices increased in September for the sixth consecutive month. According to the NMI®, 14 non-manufacturing industries reported growth in September. The comments from the respondents are mostly positive about business conditions and the overall economy. A degree of uncertainty does exist due to geopolitical conditions coupled with the upcoming U.S. presidential election."
emphasis added
 Click on graph for larger image.
This graph shows the ISM non-manufacturing index (started in January 2008) and the ISM non-manufacturing employment diffusion index.
This was well above the consensus forecast of 52.9, and suggests faster expansion in September than in August.
Trade Deficit at $40.7 Billion in August
by Calculated Risk on 10/05/2016 08:42:00 AM
From the Department of Commerce reported:
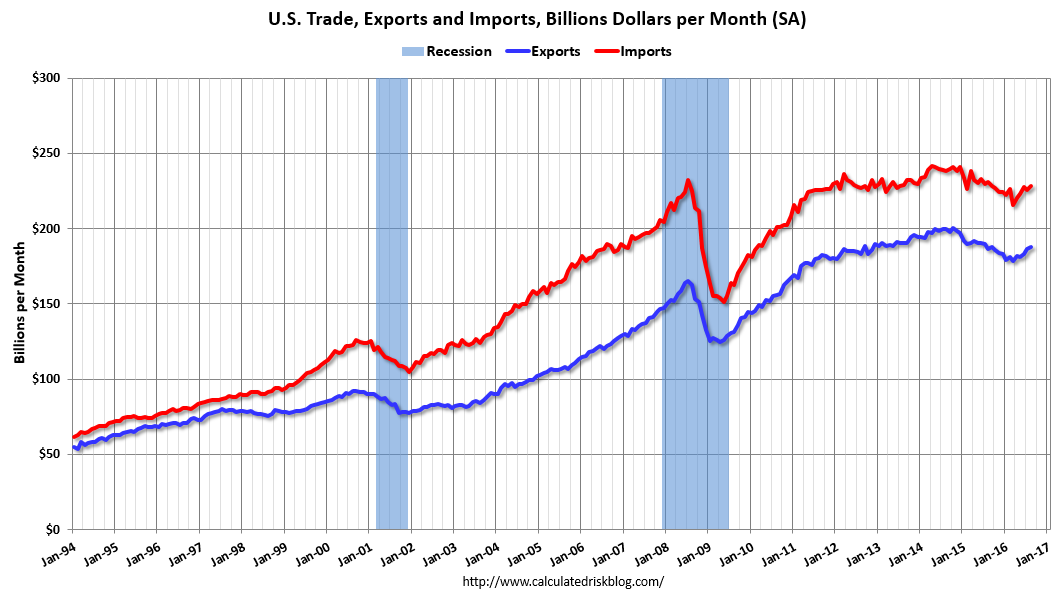
The U.S. Census Bureau and the U.S. Bureau of Economic Analysis, through the Department of Commerce, announced today that the goods and services deficit was $40.7 billion in August, up $1.2 billion from $39.5 billion in July, revised. August exports were $187.9 billion, $1.5 billion more than July exports. August imports were $228.6 billion, $2.6 billion more than July imports.The trade deficit was larger than the consensus forecast of $39.0 billion.
The first graph shows the monthly U.S. exports and imports in dollars through August 2016.
 Click on graph for larger image.
Imports and exports both increased in August.
Exports are 14% above the pre-recession peak and up 1% compared to August 2015; imports are down 1% compared to August 2015.
It appears trade might be picking up a little.
The second graph shows the U.S. trade deficit, with and without petroleum.
 The blue line is the total deficit, and the black line is the petroleum deficit, and the red line is the trade deficit ex-petroleum products.
Oil imports averaged $39.38 in August, down from $41.02 in July, and down from $49.33 in August 2015. The petroleum deficit has generally been declining and is the major reason the overall deficit has declined a little since early 2012.
The trade deficit with China decreased to $33.9 billion in August, from $35.0 billion in August 2015. The deficit with China is a substantial portion of the overall deficit, but the deficit with China has been declining.
ADP: Private Employment increased 154,000 in September
by Calculated Risk on 10/05/2016 08:19:00 AM
Private sector employment increased by 154,000 jobs from August to September according to the September ... The report, which is derived from ADP’s actual payroll data, measures the change in total nonfarm private employment each month on a seasonally-adjusted basis.This was below the consensus forecast for 170,000 private sector jobs added in the ADP report.
...
Goods-producing employment was up by 3,000 jobs in September, following August losses of 9,000. The construction industry added 11,000 jobs, following August losses of 2,000 jobs. Meanwhile, manufacturing jobs were down 6,000 in September, after losing 4,000 in the previous month.
Service-providing employment rose by 151,000 jobs in September.
...
Mark Zandi, chief economist of Moody’s Analytics, said, “The current record of consecutive monthly job gains continued in September. With job openings at all-time highs and layoffs near all-time lows, the job market remains in full-swing. Job growth has moderated in recent months, but only because the economy is finally returning to full-employment.”
The BLS report for September will be released Friday, and the consensus is for 168,000 non-farm payroll jobs added in September.
MBA: "Mortgage Applications Increase in Latest Weekly Survey"
by Calculated Risk on 10/05/2016 07:00:00 AM
From the MBA: Mortgage Applications Increase in Latest MBA Weekly Survey
Mortgage applications increased 2.9 percent from one week earlier, according to data from the Mortgage Bankers Association’s (MBA) Weekly Mortgage Applications Survey for the week ending September 30, 2016.
... The Refinance Index increased 5 percent from the previous week. The seasonally adjusted Purchase Index decreased 0.1 percent from one week earlier. The unadjusted Purchase Index decreased 0.2 percent compared with the previous week and was 14 percent lower than the same week one year ago.
...
The average contract interest rate for 30-year fixed-rate mortgages with conforming loan balances ($417,000 or less) decreased to 3.62 percent, the lowest level since July 2016, from 3.66 percent, with points decreasing to 0.32 from 0.33 (including the origination fee) for 80 percent loan-to-value ratio (LTV) loans.
emphasis added
 Click on graph for larger image.
The first graph shows the refinance index since 1990.
Refinance activity has increased this year since rates have declined.
 The second graph shows the MBA mortgage purchase index.
 The purchase index was "14 percent lower than the same week one year ago". Don't read too much into the year-over-year decline - remember last year there was a 27% jump in applications the week prior to the TILA-RESPA regulatory change. Next week applications will be up year-over-year.
Tuesday, October 04, 2016
Wednesday: Trade Deficit, ADP Employment, ISM non-Mfg Index
by Calculated Risk on 10/04/2016 06:55:00 PM
From Matthew Graham at Mortgage News Daily: Mortgage Rates Rise Quickly on Overseas Concerns
Mortgage Rates moved significantly higher today, relative to recently narrow ranges. It's enough to bring the most prevalent conventional 30yr fixed quote back up to 3.5% (from 3.375%) on top tier scenarios. ... The source of today's panic is speculation that Europe is getting closer to its own version of "tapering." This refers to the gradual reduction in the amount of bonds being purchased by central banks. In the US, the "taper tantrum" in mid 2013 was the result.Wednesday:
emphasis added
• Early, Reis Q3 2016 Mall Survey of rents and vacancy rates.
• At 7:00 AM ET, The Mortgage Bankers Association (MBA) will release the results for the mortgage purchase applications index.
• At 8:15 AM, The ADP Employment Report for September. This report is for private payrolls only (no government). The consensus is for 170,000 payroll jobs added in September, down from 177,000 added in August.
• At 8:30 AM, Trade Balance report for August from the Census Bureau. The consensus is for the U.S. trade deficit to be at $39.0 billion in August from $39.5 billion in July.
• At 10:00 AM, Manufacturers' Shipments, Inventories and Orders (Factory Orders) for August. The consensus is a 0.2% decrease in orders.
• Also at 10:00 AM, the ISM non-Manufacturing Index for September. The consensus is for index to increase to 52.9 from 51.4 in August.
Fed: Q2 Household Debt Service Ratio Very Low
by Calculated Risk on 10/04/2016 02:52:00 PM
The Fed's Household Debt Service ratio through Q2 2016 was released last week: Household Debt Service and Financial Obligations Ratios. I used to track this quarterly back in 2005 and 2006 to point out that households were taking on excessive financial obligations.
These ratios show the percent of disposable personal income (DPI) dedicated to debt service (DSR) and financial obligations (FOR) for households. Note: The Fed changed the release in Q3 2013.
The household Debt Service Ratio (DSR) is the ratio of total required household debt payments to total disposable income.This data has limited value in terms of absolute numbers, but is useful in looking at trends. Here is a discussion from the Fed:
The DSR is divided into two parts. The Mortgage DSR is total quarterly required mortgage payments divided by total quarterly disposable personal income. The Consumer DSR is total quarterly scheduled consumer debt payments divided by total quarterly disposable personal income. The Mortgage DSR and the Consumer DSR sum to the DSR.
The limitations of current sources of data make the calculation of the ratio especially difficult. The ideal data set for such a calculation would have the required payments on every loan held by every household in the United States. Such a data set is not available, and thus the calculated series is only an approximation of the debt service ratio faced by households. Nonetheless, this approximation is useful to the extent that, by using the same method and data series over time, it generates a time series that captures the important changes in the household debt service burden.
 Click on graph for larger image.
The graph shows the Total Debt Service Ratio (DSR), and the DSR for mortgages (blue) and consumer debt (yellow).
The overall Debt Service Ratio increased slightly in Q2, and has been moving sideways and is near a record low. Note: The financial obligation ratio (FOR) was unchanged in Q2 and is also near a record low (not shown)
The DSR for mortgages (blue) are near the low for the last 35 years. This ratio increased rapidly during the housing bubble, and continued to increase until 2007. With falling interest rates, and less mortgage debt (mostly due to foreclosures), the mortgage ratio has declined significantly.
The consumer debt DSR (yellow) has been increasing for the last three years.
This data suggests aggregate household cash flow has improved.
Reis: Apartment Vacancy Rate unchanged in Q3 at 4.4%
by Calculated Risk on 10/04/2016 11:59:00 AM
Reis reported that the apartment vacancy rate was at 4.4% in Q3 2016, unchanged from Q2, and up from 4.3% in Q3 2015. The vacancy rate peaked at 8.0% at the end of 2009, and bottomed at 4.2% in 2014 and early 2015.
A few comments from Reis Economist Barbara Denham:
For the sixth quarter in a row, new construction exceeded net absorption in the apartment market but only by a slim margin: 37,744 in completed units to 37,693 absorbed units. ... While there is a chance that the vacancy rate for the third quarter could still increase once the data is finalized, we had anticipated this and do not fear that rent growth will slow dramatically. In fact, rent growth in the third quarter, 0.9%, was in line with our forecasts and demonstrates the health of the apartment market. New construction should continue to exceed net absorption in most of the coming quarters ...
...
Asking and effective rents both grew by 0.9% during the third quarter, slightly below last quarter's growth of 1.1% and well short of the post-recovery high of 1.7% quarterly growth rate seen in Q3 2015. We had expected rent growth to slow so do not view this deceleration as cause for alarm. In fact, the gap between asking rents and effective rents - that net out concessions such as free rent - has not widened in the last few quarters which suggests that landlords generally remain confident that conditions will continue to improve in the wake of stronger job growth, although rents have declined in a few of the top submarkets.
The deceleration in rent growth is seen in the year-over-year growth rates. Since Q3 2015, asking and effective rents have grown 3.8%, a decline from the 4.6% year-over-year growth in asking rents and 4.5% growth rate in effective rents.
...
Market conditions in the apartment market softened a bit in the third quarter, a period they generally see the highest activity and strongest rent growth. We had expected this deceleration given the robust construction underway throughout the U.S. Evidence that recent multifamily permits have slowed considerably suggests that developers, and likely lenders, are concerned about leasing the plethora of units expected to come online in the coming year or so.
emphasis added
 Click on graph for larger image.
This graph shows the apartment vacancy rate starting in 1980. (Annual rate before 1999, quarterly starting in 1999). Note: Reis is just for large cities.
The vacancy rate had been mostly moving sideways for the last few years. Now that completions are catching up with starts, the vacancy rate has started to increase a little.
This suggests rent growth - and multi-family starts - will slow a little.
Apartment vacancy data courtesy of Reis.


