by Calculated Risk on 9/16/2016 01:03:00 PM
Friday, September 16, 2016
Fed's Flow of Funds: Household Net Worth increased in Q2
The Federal Reserve released the Q2 2016 Flow of Funds report today: Flow of Funds.
According to the Fed, household net worth increased in Q2 compared to Q1:
The net worth of households and nonprofits rose to $89.1 trillion during the second quarter of 2016. The value of directly and indirectly held corporate equities increased $452 billion and the value of real estate increased $474 billion.Household net worth was at $89.1 trillion in Q2 2016, up from $88.0 trillion in Q1 2016.
The Fed estimated that the value of household real estate increased to $22.3 trillion in Q2. The value of household real estate is just below the bubble peak in early 2006 (not adjusted for inflation, and including new construction).
 Click on graph for larger image.
The first graph shows Households and Nonprofit net worth as a percent of GDP. Household net worth, as a percent of GDP, is higher than the peak in 2006 (housing bubble), and above the stock bubble peak.
This includes real estate and financial assets (stocks, bonds, pension reserves, deposits, etc) net of liabilities (mostly mortgages). Note that this does NOT include public debt obligations.
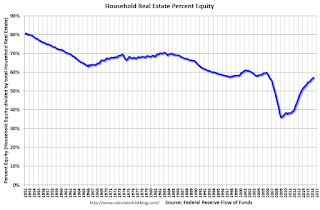 This graph shows homeowner percent equity since 1952.
 Household percent equity (as measured by the Fed) collapsed when house prices fell sharply in 2007 and 2008.
In Q2 2016, household percent equity (of household real estate) was at 57.1% - up from Q1, and the highest since Q2 2006. This was because of an increase in house prices in Q2 (the Fed uses CoreLogic).
Note: about 30.3% of owner occupied households had no mortgage debt as of April 2010. So the approximately 50+ million households with mortgages have far less than 57.1% equity - and a few million homeowners still have negative equity.
 The third graph shows household real estate assets and mortgage debt as a percent of GDP.
 Mortgage debt increased by $56 billion in Q2.
Mortgage debt has declined by $1.27 trillion from the peak. Studies suggest most of the decline in debt has been because of foreclosures (or short sales), but some of the decline is from homeowners paying down debt (sometimes so they can refinance at better rates).
The value of real estate, as a percent of GDP, was up in Q2, and is above the average of the last 30 years (excluding bubble).
Key Measures Show Inflation close to 2% in August
by Calculated Risk on 9/16/2016 11:12:00 AM
The Cleveland Fed released the median CPI and the trimmed-mean CPI this morning:
According to the Federal Reserve Bank of Cleveland, the median Consumer Price Index rose 0.2% (2.8% annualized rate) in August. The 16% trimmed-mean Consumer Price Index also rose 0.2% (2.6% annualized rate) during the month. The median CPI and 16% trimmed-mean CPI are measures of core inflation calculated by the Federal Reserve Bank of Cleveland based on data released in the Bureau of Labor Statistics' (BLS) monthly CPI report.Note: The Cleveland Fed has the median CPI details for August here.
Earlier today, the BLS reported that the seasonally adjusted CPI for all urban consumers rose 0.2% (2.4% annualized rate) in August. The CPI less food and energy rose 0.3% (3.1% annualized rate) on a seasonally adjusted basis.
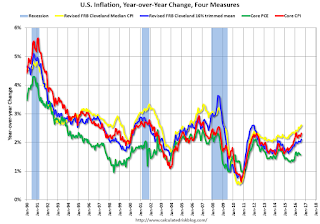 Click on graph for larger image.
This graph shows the year-over-year change for these four key measures of inflation. On a year-over-year basis, the median CPI rose 2.6%, the trimmed-mean CPI rose 2.1%, and the CPI less food and energy also rose 2.3%. Core PCE is for June and increased 1.6% year-over-year.
On a monthly basis, median CPI was at 2.8% annualized, trimmed-mean CPI was at 2.6% annualized, and core CPI was at 3.1% annualized.
Using these measures, inflation has generally been moving up, and most of these measures are at or above the Fed's target (Core PCE is still below).
Early Look at 2017 Cost-Of-Living Adjustments and Maximum Contribution Base
by Calculated Risk on 9/16/2016 08:58:00 AM
The BLS reported this morning:
The Consumer Price Index for Urban Wage Earners and Clerical Workers (CPI-W) increased 0.7 percent over the last 12 months to an index level of 234.909 (1982-84=100). For the month, the index increased 0.1 percent prior to seasonal adjustment.CPI-W is the index that is used to calculate the Cost-Of-Living Adjustments (COLA). The calculation dates have changed over time (see Cost-of-Living Adjustments), but the current calculation uses the average CPI-W for the three months in Q3 (July, August, September) and compares to the average for the highest previous average of Q3 months. Note: this is not the headline CPI-U, and is not seasonally adjusted (NSA).
• In 2014, the Q3 average of CPI-W was 234.242. In the previous year, 2013, the average in Q3 of CPI-W was 230.327. That gave an increase of 1.7% for COLA for 2015.
• In 2015, the Q3 average of CPI-W was 233.278. That was a decline of 0.4% from 2014, however, by law, the adjustment is never negative so the benefits remained the same this year (in 2016).
Since the previous highest Q3 average was in 2014 (not 2015), at 234.242, we have to compare Q3 this year to two years ago.
 Click on graph for larger image.
This graph shows CPI-W since January 2000. The red lines are the Q3 average of CPI-W for each year.
Note: The year labeled for the calculation, and the adjustment is effective for December of that year (received by beneficiaries in January of the following year).
CPI-W was up 0.7% year-over-year in August, and although this is early - we need the data for July, August and September - my guess is COLA will be slightly positive this year.
Contribution and Benefit Base
The law prohibits an increase in the contribution and benefit base if COLA is not greater than zero, so there was no change in the contribution and benefit base for 2016. However if the there is even a small increase in COLA (it will be close this year), the contribution base will be adjusted using the National Average Wage Index (and catch up for last year).
From Social Security: Cost-of-Living Adjustment Must Be Greater Than Zero
... ... any amount that is directly dependent for its value on the COLA would not increase. For example, the maximum Supplemental Security Income (SSI) payment amounts would not increase if there were no COLA.The contribution base will be adjusted using the National Average Wage Index. This is based on a one year lag. The National Average Wage Index is not available for 2015 yet, but wages probably increased again in 2015. If wages increased again last year, then the contribution base next year will increase to around $125,000 from the current $118,500.
... if there were no COLA, section 230(a) of the Social Security Act prohibits an increase in the contribution and benefit base (Social Security's maximum taxable earnings), which normally increases with increases in the national average wage index. Similarly, the retirement test exempt amounts would not increase ...
Remember - this is an early look. We still need the data for September, but it appears COLA will be slightly positive and the contribution base will increase significantly for next year.
CPI increased 0.2% in August, Core CPI up 2.3% YoY
by Calculated Risk on 9/16/2016 08:39:00 AM
The Consumer Price Index for All Urban Consumers (CPI-U) increased 0.2 percent in August on a seasonally adjusted basis, the U.S. Bureau of Labor Statistics reported today. Over the last 12 months, the all items index rose 1.1 percent before seasonal adjustment.I'll post a graph later today after the Cleveland Fed releases the median and trimmed-mean CPI. This was above the consensus forecast of a 0.1% increase for CPI, and also above the forecast of a 0.2% increase in core CPI.
The seasonally adjusted increase in the all items index was caused by a rise in the index for all items less food and energy. It increased 0.3 percent in August, as the indexes for shelter and medical care advanced. ...
The all items index rose 1.1 percent for the 12 months ending August, a larger increase than the 0.8-percent rise for the 12 months ending July. The index for all items less food and energy rose 2.3 percent for the 12 months ending August.
emphasis added
Thursday, September 15, 2016
Friday: CPI, Flow of Funds
by Calculated Risk on 9/15/2016 08:36:00 PM
From Matthew Graham at Mortgage News Daily: Mortgage Rates Sidestep Near Recent Highs
Mortgage Rates were unchanged in most cases today, keeping them near their highest levels in more than 2 months. ... The most prevalent conventional 30yr fixed rate quotes are still an eighth of a point higher than they were last week, with top tier scenarios most likely to be quoted 3.5%. That said, in cases where a quote is .125% higher (e.g. 3.5% this week vs 3.375% last week), points should be slightly lower (or lender credit slightly higher, depending on the scenario). In other words, the total damage from the past few days falls just a bit shy of a full eighth of a percentage point in rates.Friday:
emphasis added
• At 8:30 AM ET, The Consumer Price Index for August from the BLS. The consensus is for 0.1% increase in CPI, and a 0.2% increase in core CPI.
• At 10:00 AM, University of Michigan's Consumer sentiment index (preliminary for September). The consensus is for a reading of 90.8, up from 89.8 in July.
• At 12:00 PM, Q2 Flow of Funds Accounts of the United States from the Federal Reserve.
LA area Port Traffic: Exports Increased in August
by Calculated Risk on 9/15/2016 05:14:00 PM
Special note: Now that the expansion to the Panama Canal has been completed, some of the traffic that used the ports of Los Angeles and Long Beach will eventually go through the canal. This could impact TEUs on the West Coast in the future.
Container traffic gives us an idea about the volume of goods being exported and imported - and usually some hints about the trade report since LA area ports handle about 40% of the nation's container port traffic.
The following graphs are for inbound and outbound traffic at the ports of Los Angeles and Long Beach in TEUs (TEUs: 20-foot equivalent units or 20-foot-long cargo container).
To remove the strong seasonal component for inbound traffic, the first graph shows the rolling 12 month average.
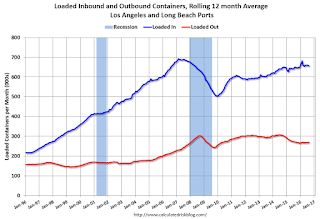
On a rolling 12 month basis, inbound traffic was down 0.4% compared to the rolling 12 months ending in July. Outbound traffic was up 0.9% compared to 12 months ending in July.
The downturn in exports over the last year was probably due to the slowdown in China and the stronger dollar.
The 2nd graph is the monthly data (with a strong seasonal pattern for imports).

In general exports might have started increasing, and imports are gradually increasing.
FNC: Residential Property Values increased 5.4% year-over-year in July
by Calculated Risk on 9/15/2016 02:49:00 PM
In addition to Case-Shiller, and CoreLogic, I'm also watching the FNC, Zillow and several other house price indexes.
FNC released their July 2016 index data. FNC reported that their Residential Price Index™ (RPI) indicates that U.S. residential property values increased 0.8% from June to July (Composite 100 index, not seasonally adjusted).
The 10 city MSA increased 0.8% (NSA), the 20-MSA RPI increased 0.8%, and the 30-MSA RPI also increased 0.8% in July. These indexes are not seasonally adjusted (NSA), and are for non-distressed home sales (excluding foreclosure auction sales, REO sales, and short sales).
Notes: In addition to the composite indexes, FNC presents price indexes for 30 MSAs. FNC also provides seasonally adjusted data.
The index is still down 10.0% from the peak in 2006 (not inflation adjusted).

This graph shows the year-over-year change based on the FNC index (four composites) through July 2016. The FNC indexes are hedonic price indexes using a blend of sold homes and real-time appraisals.
Most of the other indexes are also showing the year-over-year change in the mid single digit range.
Note: The July Case-Shiller index will be released on Tuesday, September 27th.
CoreLogic: "548,000 US Homeowners Regained Equity in the Second Quarter of 2016"
by Calculated Risk on 9/15/2016 11:59:00 AM
From CoreLogic: CoreLogic Reports 548,000 US Homeowners Regained Equity in the Second Quarter of 2016
CoreLogic ... today released a new analysis showing 548,000 U.S. homeowners regained equity in Q2 2016 compared with the previous quarter, increasing the percentage of homes with positive equity to 92.9 percent of all mortgaged properties, or approximately 47.2 million homes. Nationwide, home equity grew year over year by $646 billion, representing an increase of 9.9 percent in Q2 2016 compared with Q2 2015.On states:
In Q2 2016, the total number of mortgaged residential properties with negative equity stood at 3.6 million, or 7.1 percent of all homes with a mortgage. This is a decrease of 13.2 percent quarter over quarter from 4.2 million homes, or 8.2 percent, in Q1 2016 and a decrease of 19 percent year over year from 4.5 million homes, or 8.9 percent, compared with Q2 2015. ...
For homes in negative equity status, the national aggregate value of negative equity was $284 billion at the end of Q2 2016, decreasing approximately $20.4 billion, or 6.7 percent, from $305 billion in Q1 2016. On a year-over-year basis, the value of negative equity declined overall from $314 billion in Q2 2015, representing a decrease of 9.5 percent in 12 months.
Of the more than 50 million homes with a mortgage, approximately 8.6 million, or 17 percent, have less than 20 percent equity (referred to as under-equitied) and approximately 965,000, or 1.9 percent, have less than 5 percent equity (referred to as near-negative equity). Borrowers who are under-equitied may have a difficult time refinancing their existing homes or obtaining new financing to sell and buy another home due to underwriting constraints. Borrowers with near-negative equity are considered at risk of shifting into negative equity if home prices fall.
“Home-value gains have played a large part in restoring home equity,” said Dr. Frank Nothaft, chief economist for CoreLogic. “The CoreLogic Home Price Index for the U.S. recorded 5.2 percent growth in the year through June, an important reason that the number of owners with negative equity fell by 850,000 in the second quarter from a year earlier.”
emphasis added
"Nevada had the highest percentage of mortgaged properties in negative equity at 15.3 percent, followed by Florida (14 percent), Maryland (11.8 percent), Illinois (11.7 percent) and Arizona (11.6 percent). These top five states combined accounted for 33.7 percent of negative equity in the U.S., but only 18.6 percent of outstanding mortgages."Note: The share of negative equity is still very high in Nevada and Florida, but down from a year ago.
 Click on graph for larger image.
This graph shows the distribution of home equity in Q2 2016 compared to Q1 2016.
Less than 3% of properties have 25% or more negative equity. For reference, about four years ago, in Q3 2012, 9.6% of residential properties had 25% or more negative equity.
A year ago, in Q2 2015, there were 4.5 million properties with negative equity - now there are 3.6 million. A significant change.
Fed: Industrial Production decreased 0.4% in August
by Calculated Risk on 9/15/2016 09:23:00 AM
From the Fed: Industrial production and Capacity Utilization
Industrial production decreased 0.4 percent in August after rising 0.6 percent in July. Manufacturing output also declined 0.4 percent in August, reversing its increase in July; the level of the index in August is little changed from its level in March. Following two consecutive monthly increases, the index for utilities fell back 1.4 percent in August. Even so, the index was 1.7 percent above its year-earlier level, as hot temperatures this summer boosted the usage of air conditioning. The output of mining moved up 1.0 percent in August, its fourth consecutive monthly increase following an extended downturn; the index, however, was still about 9 percent below its year-ago level. At 104.4 percent of its 2012 average, total industrial production in August was 1.1 percent lower than its year-earlier level. Capacity utilization for the industrial sector decreased 0.4 percentage point in August to 75.5 percent, a rate that is 4.5 percentage points below its long-run (1972–2015) average.
emphasis added
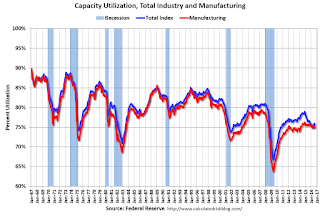 Click on graph for larger image.
This graph shows Capacity Utilization. This series is up 8.8 percentage points from the record low set in June 2009 (the series starts in 1967).
Capacity utilization at 75.5% is 4.5% below the average from 1972 to 2015 and below the pre-recession level of 80.8% in December 2007.
Note: y-axis doesn't start at zero to better show the change.
 The second graph shows industrial production since 1967.
Industrial production decreased 0.4% in August to 104.1. This is 19.4% above the recession low, and is at the pre-recession peak.
This was below expectations of a 0.2% decrease.
Retail Sales decreased 0.3% in August
by Calculated Risk on 9/15/2016 08:43:00 AM
On a monthly basis, retail sales decreased 0.3 percent from July to August (seasonally adjusted), and sales were up 1.9% from August 2015.
From the Census Bureau report:
The U.S. Census Bureau announced today that advance estimates of U.S. retail and food services sales for August, adjusted for seasonal variation and holiday and trading-day differences, but not for price changes, were $456.3 billion, a decrease of 0.3 percent from the previous month, and 1.9 percent above August 2015. ... The June 2016 to July 2016 percent change was revised from virtually unchanged to up 0.1 percent.
 Click on graph for larger image.
This graph shows retail sales since 1992. This is monthly retail sales and food service, seasonally adjusted (total and ex-gasoline).
Retail sales ex-gasoline were down 0.3% in August.
The second graph shows the year-over-year change in retail sales and food service (ex-gasoline) since 1993.
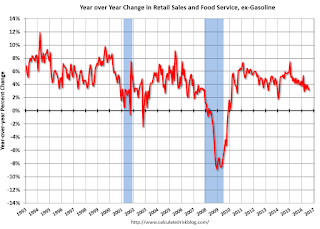 Retail and Food service sales ex-gasoline increased by 3.1% on a YoY basis.
The decrease in August was below expectations of no change for the month.


