 RSS Feed
 by Calculated Risk on 8/31/2016 06:19:00 PM
Wednesday, August 31, 2016
Thursday: Unemployment Claims, ISM Mfg Index, Construction Spending, Auto Sales
Thursday:
• At 8:30 AM ET, The initial weekly unemployment claims report will be released. The consensus is for 265 thousand initial claims, up from 261 thousand the previous week.
• At 10:00 AM, the ISM Manufacturing Index for August. The consensus is for the ISM to be at 52.2, down from 52.6 in July. The employment index was at 49.4% in July, and the new orders index was at 56.9%.
• Also at 10:00 AM, Construction Spending for July. The consensus is for a 0.6% increase in construction spending.
• All day, Light vehicle sales for August. The consensus is for light vehicle sales to decrease to 17.1 million SAAR in August, from 17.8 million in July (Seasonally Adjusted Annual Rate).
Restaurant Performance Index increased slightly in July
by Calculated Risk on 8/31/2016 01:15:00 PM
Here is a minor indicator I follow from the National Restaurant Association: RPI ticks up slightly
Although same-store sales and customer traffic levels remain somewhat uneven, the National Restaurant Association’s Restaurant Performance Index (RPI) registered a modest increase in July. The RPI stood at 100.6 in July, up 0.3 percent from June.
“The primary driver of the modest RPI gain in July was positive capital expenditure levels,” said Hudson Riehle, senior vice president of research for the National Restaurant Association.
“While there is some volatility among index components, especially when looking at the current situation, operators’ plans for capital expenditures six months out remain solid. This fits in with how operators’ outlook for the future remains overall positive despite general economic choppiness,” Riehle said.
emphasis added
 Click on graph for larger image.
The index increased to 100.6 in July, up from 100.3 in June. (above 100 indicates expansion).
Restaurant spending is discretionary, so even though this is "D-list" data, I like to check it every month.
NAR: Pending Home Sales Index increased 1.3% in July, up 1.4% year-over-year
by Calculated Risk on 8/31/2016 10:05:00 AM
From the NAR: Pending Home Sales Tick Up in July
Pending home sales expanded in most of the country in July and reached their second highest reading in over a decade, according to the National Association of Realtors®. Only the Midwest saw a dip in contract activity last month.This was above expectations of a 0.6% increase for this index. Note: Contract signings usually lead sales by about 45 to 60 days, so this would usually be for closed sales in August and September.
The Pending Home Sales Index, a forward-looking indicator based on contract signings, rose 1.3 percent to 111.3 in July from a downwardly revised 109.9 in June and is now 1.4 percent higher than July 2015 (109.8). The index is now at its second highest reading this year after April (115.0).
...
he PHSI in the Northeast moved up 0.8 percent to 96.8 in July, and is now 1.1 percent above a year ago. In the Midwest the index decreased 2.9 percent to 105.8 in July, and is now 1.1 percent lower than July 2015.
Pending home sales in the South inched higher (0.8 percent) to an index of 123.9 in July and are now 0.4 percent higher than last July. The index in the West surged 7.3 percent in July to 108.7, and is now 6.2 percent above a year ago.
emphasis added
ADP: Private Employment increased 177,000 in August
by Calculated Risk on 8/31/2016 08:19:00 AM
Private sector employment increased by 177,000 jobs from July to August according to the August ... The report, which is derived from ADP’s actual payroll data, measures the change in total nonfarm private employment each month on a seasonally-adjusted basis.This was close to the consensus forecast for 175,000 private sector jobs added in the ADP report.
...
Goods-producing employment was down by 6,000 jobs in August, following July losses of 5,000. The construction industry lost 2,000 jobs, following July losses of 5,000 jobs. Meanwhile, manufacturing jobs were flat in August, after gaining 5,000 in the previous month.
Service-providing employment rose by 183,000 jobs in August, fewer than July’s 199,000 jobs.
...
Mark Zandi, chief economist of Moody’s Analytics, said, “The American job machine continues to hum along. Job creation remains strong, with most industries and companies of all sizes adding solidly to their payrolls. The U.S. economy will soon be at full employment.”
The BLS report for August will be released Friday, and the consensus is for 175,000 non-farm payroll jobs added in August.
MBA: "Mortgage Applications Increase in Latest Weekly Survey"
by Calculated Risk on 8/31/2016 07:00:00 AM
From the MBA: Mortgage Applications Increase in Latest MBA Weekly Survey
Mortgage applications increased 2.8 percent from one week earlier, according to data from the Mortgage Bankers Association’s (MBA) Weekly Mortgage Applications Survey for the week ending August 26, 2016.
... The Refinance Index increased 4 percent from the previous week. The seasonally adjusted Purchase Index increased 1 percent from one week earlier. The unadjusted Purchase Index decreased 1 percent compared with the previous week and was 5 percent higher than the same week one year ago.
...
The average contract interest rate for 30-year fixed-rate mortgages with conforming loan balances ($417,000 or less) remained unchanged at 3.67 percent, with points decreasing to 0.33 from 0.34 (including the origination fee) for 80 percent loan-to-value ratio (LTV) loans.
emphasis added
 Click on graph for larger image.
The first graph shows the refinance index since 1990.
Refinance activity has increased this year since rates have declined.
However it would take another significant move down in mortgage rates to see a large increase in refinance activity.
 The second graph shows the MBA mortgage purchase index.
 The purchase index is "5 percent higher than the same week one year ago".
Tuesday, August 30, 2016
Wednesday: ADP employment, Pending Home Sales, Chicago PMI
by Calculated Risk on 8/30/2016 09:04:00 PM
Wednesday:
• At 7:00 AM ET, The Mortgage Bankers Association (MBA) will release the results for the mortgage purchase applications index.
• At 8:15 AM, The ADP Employment Report for August. This report is for private payrolls only (no government). The consensus is for 175,000 payroll jobs added in August, down from 179,000 added in July.
• At 9:45 AM, Chicago Purchasing Managers Index for August. The consensus is for a reading of 55.2, down from 55.8 in July.
• At 10:00 AM, Pending Home Sales Index for July. The consensus is for a 0.6% increase in the index.
Fannie Mae: Mortgage Serious Delinquency rate declined in July, Lowest since May 2008
by Calculated Risk on 8/30/2016 05:09:00 PM
Fannie Mae reported today that the Single-Family Serious Delinquency rate declined in July to 1.30%, down from 1.32% in June. The serious delinquency rate is down from 1.63% in July 2015.
These are mortgage loans that are "three monthly payments or more past due or in foreclosure".
This is the lowest rate since May 2008.
The Fannie Mae serious delinquency rate peaked in February 2010 at 5.59%.
 Click on graph for larger image
Although the rate is generally declining, the "normal" serious delinquency rate is under 1%.
The Fannie Mae serious delinquency rate has fallen 0.33 percentage points over the last year, and at that rate of improvement, the serious delinquency rate will not be below 1% until next summer.
Note: Freddie Mac reported last week.
FDIC: Fewer Problem banks, Residential REO Declined in Q2
by Calculated Risk on 8/30/2016 02:11:00 PM
The FDIC released the Quarterly Banking Profile for Q2 today:
Commercial banks and savings institutions insured by the Federal Deposit Insurance Corporation (FDIC) reported aggregate net income of $43.6 billion in the second quarter of 2016, up $584 million (1.4 percent) from a year earlier. The increase in earnings was mainly attributable to a $5.2 billion (4.8 percent) increase in net interest income and a $981 million decline in expenses for litigation reserves at a few large banks. Banks increased their loan-loss provisions by $3.6 billion (44.2 percent) compared to a year ago, partly in response to rising levels of troubled loans to commercial and industrial borrowers, particularly in the energy sector.
...
“Income and revenue both increased from a year ago, loan growth remained strong, the number of unprofitable banks was at an 18-year low, and there were fewer banks on the problem list. Community banks reported strong net income, revenue, and loan growth,” Chairman Gruenberg said.
“However, challenges continue,” he said. “Revenue growth remains sluggish as a prolonged period of low interest rates has put downward pressure on net interest margins. This has led some institutions to reach for yield, increasing their exposure to interest-rate risk.
“More recently, persistent stress in the energy sector has resulted in asset quality deterioration at banks that lend to oil and gas producers. We likely have not yet seen the full impact of low energy prices on the banking industry, particularly for consumer and commercial and industrial loans in energy-producing regions of the country.
“We will continue to closely monitor the environment in which banks operate, and we will remain vigilant as we conduct our supervision of the industry.”
...
“Problem List” Continues to Shrink: The number of banks on the FDIC’s Problem List fell from 165 to 147 during the second quarter. This is the smallest number of problem banks in more than seven years and is down significantly from the peak of 888 in the first quarter of 2011. Total assets of problem banks fell from $30.9 billion to $29.0 billion during the second quarter. Two banks failed during the quarter.
Deposit Insurance Fund’s Reserve Ratio Surpasses 1.15 Percent Benchmark: The DIF increased $2.8 billion during the second quarter, from $75.1 billion at the end of March to $77.9 billion at the end of June, largely driven by $2.3 billion in assessment income. The DIF reserve ratio rose from 1.13 percent to 1.17 percent during the quarter. Under previously approved FDIC regulations, once the reserve ratio exceeds 1.15 percent, lower regular assessment rates will go into effect. As a result of lower rates, the FDIC estimates that regular assessments paid by banks to the FDIC will decline by about one-third.
emphasis added
 Click on graph for larger image.
The FDIC reported the number of problem banks declined (Note: graph shows problem banks for Q1 and Q2 2016, and year end prior to 2016):
The number of FDIC-insured commercial banks and savings institutions reporting quarterly financial results declined to 6,058 from 6,122 in the second quarter. During the quarter, mergers absorbed 57 insured institutions, two banks failed, and no new charters were added. The number of banks on the FDIC’s “Problem List” declined from 165 to 147, and total assets of problem banks fell from $30.9 billion to $29 billion. This is the smallest number of problem banks in eight years
 The dollar value of 1-4 family residential Real Estate Owned (REOs, foreclosure houses) declined from $4.38 billion in Q1 2016 to $4.12 billion in Q2. This is the lowest level of REOs since Q1 2007.
This graph shows the nominal dollar value of Residential REO for FDIC insured institutions. Note: The FDIC reports the dollar value and not the total number of REOs.
Real Prices and Price-to-Rent Ratio in June
by Calculated Risk on 8/30/2016 11:40:00 AM
Here is the earlier post on Case-Shiller: Case-Shiller: National House Price Index increased 5.1% year-over-year in June
The year-over-year increase in prices is mostly moving sideways now around 5%. In June, the index was up 5.1% YoY.
In the earlier post, I graphed nominal house prices, but it is also important to look at prices in real terms (inflation adjusted). Case-Shiller, CoreLogic and others report nominal house prices. As an example, if a house price was $200,000 in January 2000, the price would be close to $275,000 today adjusted for inflation (37%). That is why the second graph below is important - this shows "real" prices (adjusted for inflation).
It has been almost ten years since the bubble peak. In the Case-Shiller release this morning, the National Index was reported as being 2.6% below the bubble peak. However, in real terms, the National index is still about 17.0% below the bubble peak.
Nominal House Prices
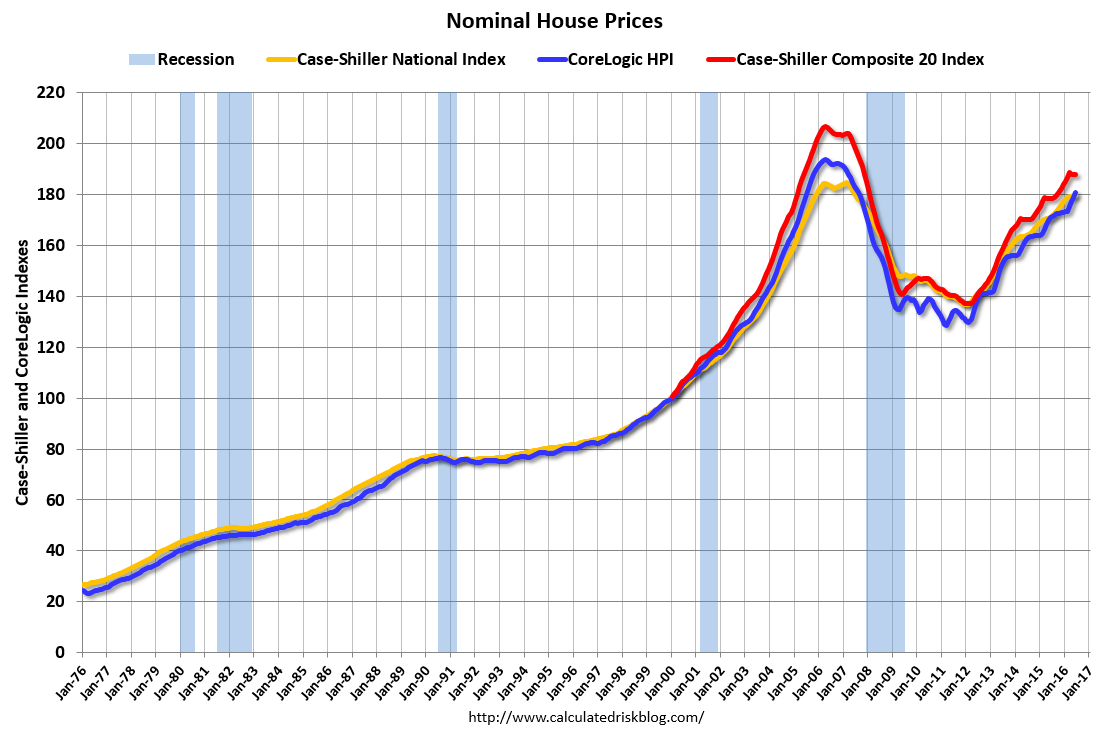 The first graph shows the monthly Case-Shiller National Index SA, the monthly Case-Shiller Composite 20 SA, and the CoreLogic House Price Indexes (through June) in nominal terms as reported.
In nominal terms, the Case-Shiller National index (SA) is back to November 2005 levels, and the Case-Shiller Composite 20 Index (SA) is back to June 2005 levels, and the CoreLogic index (NSA) is back to July 2005.
Real House Prices
 The second graph shows the same three indexes in real terms (adjusted for inflation using CPI less Shelter). Note: some people use other inflation measures to adjust for real prices.
CPI less Shelter has declined over the last two years pushing up real house prices.
In real terms, the National index is back to January 2004 levels, the Composite 20 index is back to October 2003, and the CoreLogic index back to November 2003.
In real terms, house prices are back to late 2003 levels.
Price-to-Rent
In October 2004, Fed economist John Krainer and researcher Chishen Wei wrote a Fed letter on price to rent ratios: House Prices and Fundamental Value. Kainer and Wei presented a price-to-rent ratio using the OFHEO house price index and the Owners' Equivalent Rent (OER) from the BLS.
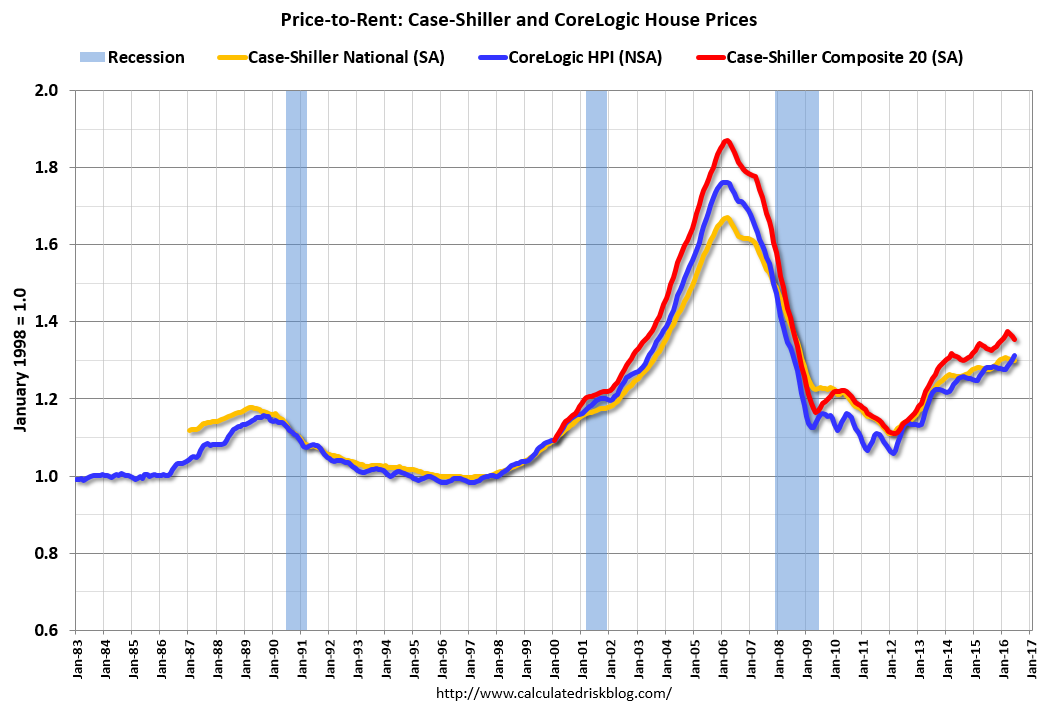 Here is a similar graph using the Case-Shiller National, Composite 20 and CoreLogic House Price Indexes.
This graph shows the price to rent ratio (January 1998 = 1.0).
On a price-to-rent basis, the Case-Shiller National index is back to July 2003 levels, the Composite 20 index is back to April 2003 levels, and the CoreLogic index is back to June 2003.
In real terms, and as a price-to-rent ratio, prices are back to late 2003 - and the price-to-rent ratio maybe moving a little more sideways now.
Case-Shiller: National House Price Index increased 5.1% year-over-year in June
by Calculated Risk on 8/30/2016 09:13:00 AM
S&P/Case-Shiller released the monthly Home Price Indices for June ("June" is a 3 month average of April, May and June prices).
This release includes prices for 20 individual cities, two composite indices (for 10 cities and 20 cities) and the monthly National index.
Note: Case-Shiller reports Not Seasonally Adjusted (NSA), I use the SA data for the graphs.
From S&P: Home Price Gains in June Concentrated in South and West According to the S&P CoreLogic Case-Shiller Indices
The S&P CoreLogic Case-Shiller U.S. National Home Price NSA Index, covering all nine U.S. census divisions, reported a 5.1% annual gain in June, unchanged from last month. The 10-City Composite posted a 4.3% annual increase, down from 4.4% the previous month.The 20-City Composite reported a year-over-year gain of 5.1%, down from 5.3% in May.
...
Before seasonal adjustment, the National Index posted a month-over-month gain of 1.0% while both the 10-City Composite and the 20-City Composite posted a 0.8% increase in June. After seasonal adjustment, the National Index recorded a 0.2% month-over-month increase, and both the 10-City Composite and 20-City Composite posted 0.1% month-over-month decreases. After seasonal adjustment, nine cities saw prices rise, two cities were unchanged, and nine cities experienced negative monthly prices changes.
emphasis added
 Click on graph for larger image.
 The first graph shows the nominal seasonally adjusted Composite 10, Composite 20 and National indices (the Composite 20 was started in January 2000).
The Composite 10 index is off 11.1% from the peak, and down 0.1% in June (SA).
The Composite 20 index is off 9.1% from the peak, and down 0.1% (SA) in June.
The National index is off 2.6% from the peak, and up 0.2% (SA) in June. The National index is up 31.6% from the post-bubble low set in December 2011 (SA).
 The second graph shows the Year over year change in all three indices.
The Composite 10 SA is up 4.3% compared to June 2015.
The Composite 20 SA is up 5.1% year-over-year.
The National index SA is up 5.1% year-over-year.
Note: According to the data, prices increased in 10 of 20 cities month-over-month seasonally adjusted.
I'll have more later.


