by Calculated Risk on 2/18/2015 08:39:00 AM
Wednesday, February 18, 2015
Housing Starts decreased to 1.065 Million Annual Rate in January
From the Census Bureau: Permits, Starts and Completions
Housing Starts:
Privately-owned housing starts in January were at a seasonally adjusted annual rate of 1,065,000. This is 2.0 percent below the revised December estimate of 1,087,000, but is 18.7 percent above the January 2014 rate of 897,000.
Single-family housing starts in January were at a rate of 678,000; this is 6.7 percent below the revised December figure of 727,000. The January rate for units in buildings with five units or more was 381,000.
emphasis added
Building Permits:
Privately-owned housing units authorized by building permits in January were at a seasonally adjusted annual rate of 1,053,000. This is 0.7 percent below the revised December rate of 1,060,000, but is 8.1 percent above the January 2014 estimate of 974,000.
Single-family authorizations in January were at a rate of 654,000; this is 3.1 percent (±0.9%) below the revised December figure of 675,000. Authorizations of units in buildings with five units or more were at a rate of 372,000 in January.
 Click on graph for larger image.
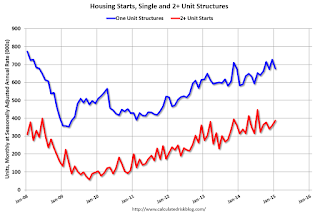
The first graph shows single and multi-family housing starts for the last several years.
Multi-family starts (red, 2+ units) increased slightly in January. Multi-family starts are up 23% year-over-year.
Single-family starts (blue) decreased slightly in January and are up 16% year-over-year.
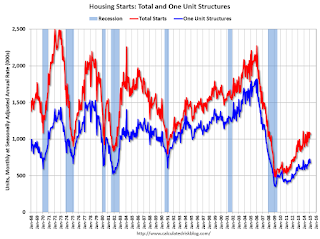
The second graph shows total and single unit starts since 1968.
 The second graph shows the huge collapse following the housing bubble, and - after moving sideways for about two years and a half years - housing is now recovering (but still historically low),
This was close to expectations of 1.070 million starts in January, although starts in November and December were revised down. Overall this was a decent report with housing starts up almost 19% year-over-year (starts were weak in early 2014). I'll have more later ...
MBA: Mortgage Applications Decrease in Latest MBA Weekly Survey
by Calculated Risk on 2/18/2015 07:00:00 AM
From the MBA: Mortgage Applications Decrease in Latest MBA Weekly Survey
Mortgage applications decreased 13.2 percent from one week earlier, according to data from the Mortgage Bankers Association’s (MBA) Weekly Mortgage Applications Survey for the week ending February 13, 2015. ...
The Refinance Index decreased 16 percent from the previous week. The seasonally adjusted Purchase Index decreased 7 percent from one week earlier.
...
“Mortgage rates increased to their highest level since the beginning of the year last week, and application volume dropped sharply as a result, particularly for refinances. The market index declined to its lowest level since the week ending January 2nd as purchase application activity decreased seven percent and refinance applications decreased 16 percent. Refinance volume fell particularly for larger loans, as evidenced by the decline of almost $25,000 in the average loan size for a refinance loan,” said Mike Fratantoni, MBA’s Chief Economist.
The average contract interest rate for 30-year fixed-rate mortgages with conforming loan balances ($417,000 or less) increased to 3.93 percent from 3.84 percent, with points increasing to 0.35 from 0.31 (including the origination fee) for 80 percent loan-to-value ratio (LTV) loans.
emphasis added
 Click on graph for larger image.
The first graph shows the refinance index.
2014 was the lowest year for refinance activity since year 2000.
2015 will probably see more refinance activity than in 2014, but not a large refinance boom.
 The second graph shows the MBA mortgage purchase index.
 According to the MBA, the unadjusted purchase index is up 1% from a year ago.
Tuesday, February 17, 2015
Wednesday: Housing Starts, Industrial Production, PPI, FOMC Minutes
by Calculated Risk on 2/17/2015 07:01:00 PM

A cool map of ships anchored in the Long Beach area from Ron Schweitzer, of Long Beach, CA.
Ron captured this yesterday, on a return trip from Catalina, using the iPhone app Boat Beacon. This app shows all the big commercial vessels on your phone, and Ron wrote that he had to “thread the needle” to get back to the marina!
Wednesday:
• At 7:00 AM ET, the Mortgage Bankers Association (MBA) will release the results for the mortgage purchase applications index.
• At 8:30 AM, Housing Starts for January. Total housing starts were at 1.089 million (SAAR) in December. Single family starts were at 679 thousand SAAR in December. The consensus is for total housing starts to decrease to 1.070 million (SAAR) in January.
• At 8:30 AM, The Producer Price Index for January from the BLS. The consensus is for a 0.4% decrease in prices, and a 0.1% increase in core PPI.
• At 9:15 AM, The Fed will release Industrial Production and Capacity Utilization for January. The consensus is for a 0.4% increase in Industrial Production, and for Capacity Utilization to increase to 79.9%.
• During the day: The AIA's Architecture Billings Index for January (a leading indicator for commercial real estate).
• At 2:00 PM, FOMC Minutes for Meeting of January 27-28, 2015
DataQuick: Southern California January Home Sales down 6% Year-over-year
by Calculated Risk on 2/17/2015 04:22:00 PM
From DataQuick: Southern California Home Sales Decline; Median Sale Price Still Up Year Over Year
Home sales in January fell sharply from December, as they normally do, and dipped modestly from a year earlier, marking the 14th month in the last 16 to post a year-over-year sales decline. ... A total of 13,560 new and resale houses and condos sold in Los Angeles, Riverside, San Diego, Ventura, San Bernardino and Orange counties in January 2015. That was down month over month 29.4 percent from 19,205 sales in December 2014, and down year over year 6.3 percent from 14,471 sales in January 2014, according to CoreLogic DataQuick data.January is a seasonal slow month, so I wouldn't read too much into the sales decline.
"The January and February statistics are always interesting, and sometimes a bit strange, but they're not necessarily a good indication of what's to come," said Andrew LePage, data analyst for CoreLogic DataQuick. "That's largely because many traditional buyers and sellers drop out of the housing market during the holidays and mid winter, and therefore don’t close deals during those months. In recent years that's led to somewhat higher concentrations of investor activity for January and February, and we saw that again last month. Heading into spring it will be interesting to see whether price appreciation and other factors will finally release a lot of the pent-up supply of homes out there. More owners have gained enough equity to sell and buy another home and more will be satisfied with how much their homes can fetch. At the same time, recent gains in job and income growth, coupled with low mortgage rates, could stoke demand and put significant pressure on prices unless we see a meaningful jump in inventory.”
...
Foreclosure resales represented 5.7 percent of the resale market in January. That was up from a revised 5.3 percent in December 2014 and down from 6.6 percent in January 2014. In recent months the foreclosure resale rate has been the lowest since early 2007. In the current cycle, foreclosure resales hit a high of 56.7 percent in February 2009. Foreclosure resales are purchased homes that have been previously foreclosed upon in the prior 12 months.
Short sales made up an estimated 6.5 percent of resales in January, up from a revised 6.2 in December 2014 and down from 10.7 percent in January 2014. Short sales are transactions in which the sale price fell short of what was owed on the property.
emphasis added
A couple of key points from LePage: 1) the percent of distress sales usually increases in January, because traditional sales fall off sharply - so it is important to look at the year-over-year change in distressed sales (down to 12.2% from 17.3% a year ago), and 2) we might see more upward price pressure unless inventory increases.
NY Fed: Household Debt increased in Q4 2014
by Calculated Risk on 2/17/2015 11:51:00 AM
Here is the Q4 report: Household Debt and Credit Report.
From the NY Fed: Household Debt Continues Upward Climb While Student Loan Delinquencies Worse
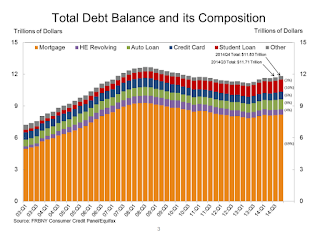
In its Q4 2014 Household Debt and Credit Report, the Federal Reserve Bank of New York announced that outstanding household debt increased $117 billion from the third quarter. The one percent increase puts total household indebtedness at $11.83 trillion as of December 31, 2014. Total debt has gone up $326 billion since the fourth quarter of 2013. The report is based on data from the New York Fed’s Consumer Credit Panel, a nationally representative sample drawn from anonymized Equifax credit data.
Balances were largely up across the board, led by mortgages ($39 billion) and student loans ($31 billion). Auto loan debt and credit card debt increased by $21 billion and $20 billion, respectively. Outstanding student loan balances now stand at $1.16 trillion.
While overall delinquency rates were unchanged at 4.3 percent in the fourth quarter, delinquency rates for auto loans and student loans worsened. Our Liberty Street Economics blog post provides a further discussion of the delinquency picture.
“Although we’ve seen an overall improvement in delinquency rates since the Great Recession, the increasing trend in student loan balances and delinquencies is concerning,” said Donghoon Lee, research officer at the Federal Reserve Bank of New York. “Student loan delinquencies and repayment problems appear to be reducing borrowers’ ability to form their own households.”
emphasis added
 Click on graph for larger image.
Here are two graphs from the report:
The first graph shows aggregate consumer debt increased in Q4. Household debt peaked in 2008, and bottomed in Q2 2013.
The recent increase in debt suggests households (in the aggregate) deleveraging is over.
 The second graph shows the percent of debt in delinquency. The percent of delinquent debt is generally declining, although there is still a large percent of debt 90+ days delinquent (Yellow, orange and red).
 The overall delinquency rate decreased to 6.0% in Q4, from 6.2% in Q3. Most of the improvement was in the less than 30 day category.
The Severely Derogatory (red) rate has fallen to 2.17%, the lowest since Q1 2008.
The 120+ days late (orange) rate has was unchanged at 1.82%, the lowest since Q2 2008.
In general, short term delinquencies are back to normal levels.
There are a number of credit graphs at the NY Fed site.
NAHB: Builder Confidence decreased to 55 in February
by Calculated Risk on 2/17/2015 10:05:00 AM
The National Association of Home Builders (NAHB) reported the housing market index (HMI) was at 55 in February, down from 57 in January. Any number above 50 indicates that more builders view sales conditions as good than poor.
From Reuters: Builder Confidence Slightly Lower in February on Harsh Weather Conditions
Builder confidence in the market for newly built, single-family homes in February fell two points to a level of 55 on the National Association of Home Builders/Wells Fargo Housing Market Index (HMI) released today.
Overall, builder sentiment remains fairly solid, with this slight downturn largely attributable to the unusually high snow levels across much of the nation,” said NAHB Chairman Tom Woods, a home builder from Blue Springs, Mo.
“For the past eight months, confidence levels have held in the mid- to upper 50s range, which is consistent with a modest, ongoing recovery,” said NAHB Chief Economist David Crowe. “Solid job growth, affordable home prices and historically low mortgage rates should help unleash growing pent-up demand and keep the housing market moving forward in the year ahead.”
Two of the three HMI components posted losses in February. The component gauging current sales conditions edged one point lower to 61 while the component measuring buyer traffic fell five points to 39. The gauge charting sales expectations in the next six months held steady at 60.
emphasis added
 Click on graph for larger image.
This graph show the NAHB index since Jan 1985.
This was below the consensus forecast of 58.
NY Fed: Empire State Manufacturing Survey indicates "business activity continued to expand at a modest pace" in February
by Calculated Risk on 2/17/2015 08:45:00 AM
From the NY Fed: Empire State Manufacturing Survey
The February 2015 Empire State Manufacturing Survey indicates that business activity continued to expand at a modest pace for New York manufacturers. The headline general business conditions index edged down two points to 7.8. The new orders index fell five points to 1.2—evidence that orders were flat—while the shipments index climbed to 14.1. Employment indexes pointed to an increase in employment levels and little change in the average workweek. ...This is the first of the regional surveys for February. The general business conditions index was below the consensus forecast of a reading of 9.0, and indicates modest expansion in February.
...
Indexes assessing the six-month outlook, though generally positive, conveyed considerably less optimism about future business activity than in recent months. The index for future general business conditions plunged twenty-three points to 25.6, its lowest level in more than two years.
emphasis added
Monday, February 16, 2015
Tuesday: Empire State Mfg, Homebuilder Confidence
by Calculated Risk on 2/16/2015 07:11:00 PM
From the WSJ: Greek Financing Talks Break Down Amid Wide Gulf Over Bailout
“The general feeling [among ministers] is still that the best way forward would be for the Greek authorities to seek an extension of the current program,” said Jeroen Dijsselbloem, the Dutch minister who presides over the regular meetings with his counterparts. “We simply need more time,” he added.I've read the proposed draft statement for an extension - and it was absurd - there is no way the Greeks will sign it.
After the meeting, Mr. Varoufakis said he had been ready to request a four-month extension to the existing bailout, but not under the conditions that Mr. Dijsselbloem and the other ministers were offering. “Our only condition for doing this was that we should not be asked to impose measures that are clearly recessionary and clearly uncalled for in the state of humanitarian crisis we have in Greece,” he said.
Tuesday:
• At 8:30 AM ET, the NY Fed Empire State Manufacturing Survey for February. The consensus is for a reading of 9.0, down from 10.0 last month (above zero is expansion).
• At 10:00 AM, the February NAHB homebuilder survey. The consensus is for a reading of 58, up from 57 in January. Any number above 50 indicates that more builders view sales conditions as good than poor.
Weekend:
• Schedule for Week of February 15, 2015
From CNBC: Pre-Market Data and Bloomberg futures: currently S&P futures are down 9 and DOW futures are down 65 (fair value).
Oil prices were up over the last week with WTI futures at $52.72 per barrel and Brent at $61.40 per barrel. A year ago, WTI was at $100, and Brent was at $109 - so prices are down about 45% year-over-year.
Below is a graph from Gasbuddy.com for nationwide gasoline prices. Nationally prices are around $2.25 per gallon (down about $1.10 per gallon from a year ago). If you click on "show crude oil prices", the graph displays oil prices for WTI, not Brent; gasoline prices in most of the U.S. are impacted more by Brent prices.
| Orange County Historical Gas Price Charts Provided by GasBuddy.com |
Ships, Ships, Everywhere Ships
by Calculated Risk on 2/16/2015 03:54:00 PM
From the LA Times: Line of ships waiting off coast grows as ports shut down for holiday
On Monday, there were 33 vessels anchored off the Los Angeles and Long Beach ports, unable to dock, according to the Marine Exchange of Southern California. That was three more than Sunday.
...
The White House is sending Labor Secretary Tom Perez to jump-start stalled contract talks between the employer group, Pacific Maritime Assn., and the International Longshore and Warehouse Union. Perez is scheduled to meet with both sides Tuesday, according to a Department of Labor spokeswoman.
Report: "Eurozone's Greek talks collapse early"
by Calculated Risk on 2/16/2015 01:16:00 PM
The Financial Times has the draft text: Eurozone's Greek talks collapse early
The draft text, obtained by the Financial Times, states that Greece would agree to a six-month "technical extension" of its current bailout ... "This would bridge the time for Greece authorites and the Eurogroup to work on a follow-up arrangement," ... Athens would "successfully conclude the programme, taking into accounts the new government's plans" and promised the "best use of the existing flexibility in the current programme".Greece rejected this statement.
Press conference here.


