by Calculated Risk on 2/17/2015 11:51:00 AM
Tuesday, February 17, 2015
NY Fed: Household Debt increased in Q4 2014
Here is the Q4 report: Household Debt and Credit Report.
From the NY Fed: Household Debt Continues Upward Climb While Student Loan Delinquencies Worse
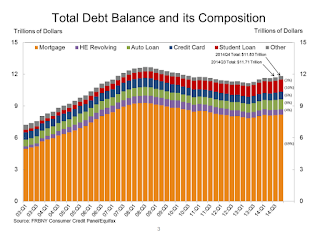
In its Q4 2014 Household Debt and Credit Report, the Federal Reserve Bank of New York announced that outstanding household debt increased $117 billion from the third quarter. The one percent increase puts total household indebtedness at $11.83 trillion as of December 31, 2014. Total debt has gone up $326 billion since the fourth quarter of 2013. The report is based on data from the New York Fed’s Consumer Credit Panel, a nationally representative sample drawn from anonymized Equifax credit data.
Balances were largely up across the board, led by mortgages ($39 billion) and student loans ($31 billion). Auto loan debt and credit card debt increased by $21 billion and $20 billion, respectively. Outstanding student loan balances now stand at $1.16 trillion.
While overall delinquency rates were unchanged at 4.3 percent in the fourth quarter, delinquency rates for auto loans and student loans worsened. Our Liberty Street Economics blog post provides a further discussion of the delinquency picture.
“Although we’ve seen an overall improvement in delinquency rates since the Great Recession, the increasing trend in student loan balances and delinquencies is concerning,” said Donghoon Lee, research officer at the Federal Reserve Bank of New York. “Student loan delinquencies and repayment problems appear to be reducing borrowers’ ability to form their own households.”
emphasis added
 Click on graph for larger image.
Here are two graphs from the report:
The first graph shows aggregate consumer debt increased in Q4. Household debt peaked in 2008, and bottomed in Q2 2013.
The recent increase in debt suggests households (in the aggregate) deleveraging is over.
 The second graph shows the percent of debt in delinquency. The percent of delinquent debt is generally declining, although there is still a large percent of debt 90+ days delinquent (Yellow, orange and red).
 The overall delinquency rate decreased to 6.0% in Q4, from 6.2% in Q3. Most of the improvement was in the less than 30 day category.
The Severely Derogatory (red) rate has fallen to 2.17%, the lowest since Q1 2008.
The 120+ days late (orange) rate has was unchanged at 1.82%, the lowest since Q2 2008.
In general, short term delinquencies are back to normal levels.
There are a number of credit graphs at the NY Fed site.


