by Calculated Risk on 1/06/2015 08:21:00 PM
Tuesday, January 06, 2015
Wednesday: ADP Employment, Trade Deficit, FOMC Minutes
For fun, here are Byron Wien's Ten Surprises for 2015. Here are a few:
1. The Federal Reserve finally raises short-term interest rates, well before the middle of the year, encouraged by the improving employment data and strong Gross Domestic Product growth. The timing proves faulty, however, as the momentum of the economy has begun to flag and a short-term slowdown has started. The end of monetary accommodation and rising rates precipitate a correction in equities. Long-term Treasury rates stay where they started and the yield curve flattens. [CR Note: I doubt the Fed will raise rates "well before the middle of the year"]Wednesday:
3. The year-end 2014 rally in United States equities continues as the market rises for a strong performance in 2015. A growing economy, fueled by housing and capital spending and favorable earnings, enables the Standard & Poor’s 500 to increase 15% during the year, outperforming equities in most major industrialized countries throughout the world.
4. Mario Draghi finally begins to expand the balance sheet of the European Central Bank aggressively by buying sovereign debt, mortgages and corporate bonds. In spite of this expansion, Europe falls back into a serious recession. Germany is particularly weak as reduced demand from various trading partners has a major impact on its exports. The European policy makers fail to embrace the one option, fiscal spending, that could turn the economy around, and European stocks decline. Politically, Europe moves dangerously toward the right. [CR Note: Unfortunately probably close.]
8. Brent slips into the $40s. The low price of crude oil, which continues throughout the first part of the year, has a major impact on Russia. A peace settlement with Ukraine is signed, giving Eastern Ukraine substantial autonomy but guaranteeing the sovereignty of the rest of the country. President Putin seems to be trying to win back the respect of the international community as the country reels from its economic problems, but the Russian citizenry finally turns on him. His approval rating plummets and he resigns by year-end. During the second half of the year, West Texas Intermediate and Brent crude are both above $70, as emerging market demand continues to increase. [CR Note: Brent into the $40s is already close. Brent closed at $51.10 today.]
• At 7:00 AM ET, the Mortgage Bankers Association (MBA) will release the results for the mortgage purchase applications index.
• At 8:15 AM, the ADP Employment Report for December. This report is for private payrolls only (no government). The consensus is for 223,000 payroll jobs added in December, up from 207,000 in November.
• At 8:30 AM, the Trade Balance report for November from the Census Bureau. The consensus is for the U.S. trade deficit to be at $42.0 billion in November from $43.4 billion in October.
• Early, Reis Q4 2014 Mall Survey of rents and vacancy rates.
• At 2:00 PM, the FOMC Minutes for Meeting of December 16-17, 2014
30 Year Mortgage Rates fall to 3.68%, Down almost 100bps year-over-year
by Calculated Risk on 1/06/2015 04:09:00 PM
With the rally in the Ten Year today - yields declined to 1.89% mid-day and closed at 1.96% - the 30 year mortgage rate also declined, and is now down almost 100bps from a year ago.
From Matthew Graham at Mortgage News Daily: Opportunity Knocks as Mortgage Rates Surge Lower
Mortgage rates are on an absolute tear. In the past 2 days, they've rocketed a full eighth of a point lower. They're a full quarter point lower than the average rates available in 2nd half of December and .375% lower than December's highest rates. For anyone feeling like they missed out in May 2013 as the taper tantrum began, here's your opportunity. Today is officially the first day we can say that rate sheets are at least as good as May 21st, 2013, the day before Bernanke's congressional testimony unofficially kicked off the taper tantrum and sent mortgage rates quickly higher.Note: rates are still above the level required for a significant increase in refinance activity. Historically refinance activity picks up significantly when mortgage rates fall about 50 bps from a recent level.
At that time, the abrupt rise meant a move up to 3.75% from 3.625%. Today's gains restore 3.625% as the lowest widely-available rate for the best borrowers.
Many borrowers who took out mortgages over the last 18 months can refinance now - but that is a small number of total borrowers. For a significant increase in refinance activity, rates would have to fall below the late 2012 lows (on a monthly basis, 30 year mortgage rates were at 3.35% in the PMMS in November and December 2012).
Based on the relationship between the 30 year mortgage rate and 10-year Treasury yields, the 10-year Treasury yield would probably have to decline to 1.5% or lower for a significant refinance boom (in the near future). With the 10-year yield currently at 1.96%, I don't expect a significant increase in refinance activity.
Here is a table from Mortgage News Daily:
Office Vacancy Rate and Office Investment
by Calculated Risk on 1/06/2015 01:47:00 PM
Yesterday I noted that Reis reported the office vacancy rate declined to 16.7% in Q4 from 16.8% in Q3.
A key question is when will new office investment increase significantly. Investment has been increasing - and adding to GDP - but investment is still very low. The following graph shows the office vacancy rate and office investment as a percent of GDP. Note: Office investment also includes improvements.
Here is Reis Senior Economist Ryan Severino's office forecast for 2015:
"2014 ended with lots of good news and optimistic data, for both the macroeconomy and the office market. GDP growth, labor market growth, net absorption, and vacancy are all trending in the right direction and at a faster pace over time. Barring some idiosyncratic shock, there is no reason to believe that these trends will not persist in 2015 while construction should remain in check due to relatively weak fundamentals in many markets, even as speculative development slowly returns to the market in stronger metro areas. Therefore, we are not only forecasting stronger rent growth for 2015 than 2014, but vacancy compression should slowly begin to accelerate and the potential exists for the market to outperform our expectations if the economy is even stronger than currently forecast. This is the most sanguine that we have been about the economy and the office market since before the recession."
 Click on graph for larger image.
This graph shows the office vacancy rate starting in 1980 (prior to 1999 the data is annual). Back in the early '80s, there was overbuilding in the office sector even as the vacancy rate was rising. This was due to the very loose lending that led to the S&L crisis.
In the '90s, office investment picked up as the vacancy rate fell. Following the bursting of the stock bubble, the vacancy rate increased sharply and office investment declined.
During the housing bubble, office investment started to increase even before the vacancy rate had fallen below 14%. This was due to loose lending - again. Investment essentially stopped following the financial crisis.
Even with the recent increases, office investment is below the levels of previous slow periods - and the vacancy rate is still very high. Like Reis, I expect the office vacancy rate to continue to decline, and for office investment to slowly recover.
Office vacancy data courtesy of Reis.
ISM Non-Manufacturing Index decreased to 56.2% in December
by Calculated Risk on 1/06/2015 10:06:00 AM
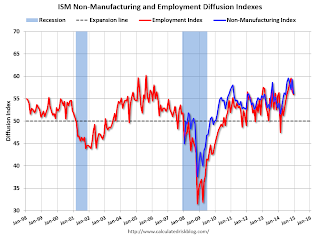
The December ISM Non-manufacturing index was at 56.2%, down from 59.3% in November. The employment index decreased in December to 56.0%, down from 56.7% in November. Note: Above 50 indicates expansion, below 50 contraction.
From the Institute for Supply Management: December 2014 Non-Manufacturing ISM Report On Business®
Economic activity in the non-manufacturing sector grew in December for the 59th consecutive month, say the nation’s purchasing and supply executives in the latest Non-Manufacturing ISM® Report On Business®.
The report was issued today by Anthony Nieves, CPSM, C.P.M., CFPM, chair of the Institute for Supply Management® (ISM®) Non-Manufacturing Business Survey Committee. "The NMI® registered 56.2 percent in December, 3.1 percentage points lower than the November reading of 59.3 percent. This represents continued growth in the non-manufacturing sector. The Non-Manufacturing Business Activity Index decreased to 57.2 percent, which is 7.2 percentage points lower than the November reading of 64.4 percent, reflecting growth for the 65th consecutive month at a slower rate. The New Orders Index registered 58.9 percent, 2.5 percentage points lower than the reading of 61.4 percent registered in November. The Employment Index decreased 0.7 percentage point to 56 percent from the November reading of 56.7 percent and indicates growth for the tenth consecutive month. The Prices Index decreased 4.9 percentage points from the November reading of 54.4 percent to 49.5 percent, indicating prices contracted in December when compared to November. According to the NMI®, 12 non-manufacturing industries reported growth in December. Comments from respondents are mostly positive about business conditions and the overall economy for year-end.""
emphasis added
 Click on graph for larger image.
This graph shows the ISM non-manufacturing index (started in January 2008) and the ISM non-manufacturing employment diffusion index.
This was below the consensus forecast of 58.2% and suggests slower expansion in December than in November. Still a decent report.
CoreLogic: House Prices up 5.5% Year-over-year in November
by Calculated Risk on 1/06/2015 09:03:00 AM
Notes: This CoreLogic House Price Index report is for November. The recent Case-Shiller index release was for October. The CoreLogic HPI is a three month weighted average and is not seasonally adjusted (NSA).
From CoreLogic: CoreLogic Reports Home Prices Rose by 5.5 Percent Year Over Year in November 2014
Home prices nationwide, including distressed sales, increased 5.5 percent in November 2014 compared to November 2013. This change represents 33 months of consecutive year-over-year increases in home prices nationally. On a month-over-month basis, home prices nationwide, including distressed sales, rose by 0.1 percent in November 2014 compared to October 2014.
...
Excluding distressed sales, home prices nationally increased 5.3 percent in November 2014 compared to November 2013 and 0.3 percent month over month compared to October 2014. Also excluding distressed sales, all states and the District of Columbia showed year-over-year home price appreciation in November. Distressed sales include short sales and real estate owned (REO) transactions. ...
“After decelerating for most of the year, home price growth has been holding firm between a 5-percent and 6-percent growth rate for the last four months,” said Sam Khater, deputy chief economist at CoreLogic. “However, pockets of weakness are clear in Baltimore and Washington D.C., and three of the top four states with the highest price appreciation are energy intensive and had been benefitting from the energy boom which is currently receding as oil prices trend downward. These states—Texas, Colorado and North Dakota, may see some downward pressure on prices in 2015.”
emphasis added
 Click on graph for larger image.
 This graph shows the national CoreLogic HPI data since 1976. January 2000 = 100.
The index was up 0.1% in November, and is up 5.5% over the last year.
This index is not seasonally adjusted, and this small - but positive - month-to-month increase was during the seasonally weak period.
 The second graph is from CoreLogic. The year-over-year comparison has been positive for thirty three consecutive months suggesting house prices bottomed early in 2012 on a national basis (the bump in 2010 was related to the tax credit).
The YoY increases had been slowing, but has moved sideways over the last few months.
Reis: Apartment Vacancy Rate unchanged in Q4 at 4.2%
by Calculated Risk on 1/06/2015 08:28:00 AM
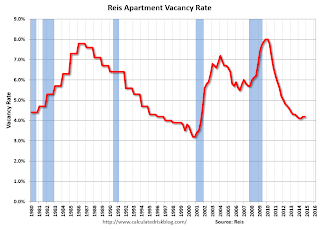
Reis reported that the apartment vacancy rate was unchanged in Q4 at 4.2%, the same as in Q3. In Q4 2013 (a year ago), the vacancy rate was also at 4.2%, and the rate peaked at 8.0% at the end of 2009.
Some comments from Reis Senior Economist Ryan Severino:
The national vacancy rate was unchanged at 4.2% during the fourth quarter. This follows last quarter's slight 10 basispoint increase in vacancy which was the first increase since the fourth quarter of 2009. Although vacancy did not continue to increase this quarter, the unchanged vacancy rate shows that the days of excess demand are likely over. Additionally, the surge in construction that we have observed in recent periods eased a bit this quarter after increasing during each of the last two quarters. Some of this is due to seasonality ‐ the market tends to slow during the fourth and first quarters of calendar years. Meanwhile, demand had a surprising rebound during the fourth quarter to 45,027 units, the highest quarterly figure since the fourth quarter of 2013. This is an important point ‐ even as construction increases in 2015 and beyond, demand will remain robust due to the large number of young renters in the US. However, as we mentioned last quarter, this is the beginning of an up cycle in vacancy and demand will struggle to keep pace with the significant amounts of new construction that should come online over the next few years.
...
While the market is still very tight at 4.2%, that level of vacancy is not going to be sustainable over the next few years. Supply will outpace demand and vacancy will slowly drift upward. While we still anticipate that the market will remain relatively tight, rising vacancy is likely to put downward pressure on NOI growth over the next few years, even as rents continue to grow.
Asking and effective rents both grew by 0.6% during the fourth quarter. This is a bit of a slowdown from the pace observed during the second and third quarters, but seasonality surely contributed to this. This was the weakest quarterly rate of rent growth since the first quarter of 2013. None the less, the trend in rents over time is up. 2014 annual rent growth for asking and effective rents was 3.5% and 3.6%, respectively. Not only is this the best performance in the apartment market since 2007, but apartment easily remains the best performing property type in this respect. Yet again, rents reached record‐high nominal levels during the fourth quarter. Although an improving labor market with more jobs and faster wage growth should provide landlords with more leverage to increase rents, over time this will be stymied by the sheer number of new units that are going to come online, increasing competition in the market. Although rent growth should remain positive for the next five years, the rate of growth is anticipated to slow, even as new units come online with rents that are higher than the market average.
emphasis added
 Click on graph for larger image.
This graph shows the apartment vacancy rate starting in 1980. (Annual rate before 1999, quarterly starting in 1999). Note: Reis is just for large cities.
Apartment vacancy data courtesy of Reis.
Monday, January 05, 2015
Tuesday: ISM Non-Manufacturing Index
by Calculated Risk on 1/05/2015 07:32:00 PM
For fun, here is a graph (click on graph for larger image) from Doug Short and shows the S&P 500 since the 2007 high ...
Tuesday:
• Early: Reis Q4 2014 Apartment Survey of rents and vacancy rates.
• At 10:00 AM ET, Manufacturers' Shipments, Inventories and Orders (Factory Orders) for November. The consensus is for a 0.2 decrease in November orders.
• Also at 10:00 AM ET, ISM non-Manufacturing Index for December. The consensus is for a reading of 58.2, down from 59.3 in November. Note: Above 50 indicates expansion.
U.S. Light Vehicle Sales decrease to 16.8 million annual rate in December
by Calculated Risk on 1/05/2015 02:05:00 PM
Based on a WardsAuto estimate, light vehicle sales were at a 16.75 million SAAR in December. That is up 8.8% from December 2013, and down 1.7% from the 17.09 million annual sales rate last month.

This graph shows the historical light vehicle sales from the BEA (blue) and an estimate for December (red, light vehicle sales of 16.75 million SAAR from WardsAuto).
This was below the consensus forecast of 16.9 million SAAR (seasonally adjusted annual rate).

Note: dashed line is current estimated sales rate.
This was another strong month for vehicle sales - the eighth consecutive month with a sales rate over 16 million - and the best year since 2006.
WTI Crude Oil Falls Close to $50 per Barrel
by Calculated Risk on 1/05/2015 11:41:00 AM
From Business Insider: Oil Keeps Falling
US crude and Brent futures dropped to fresh 5-1/2-year lows Monday as worries about a surplus of global supplies amid weak demand continued to drag on oil markets.Note: For why prices are falling, see A Comment on Oil Prices and Question #7 for 2015: What about oil prices in 2015?
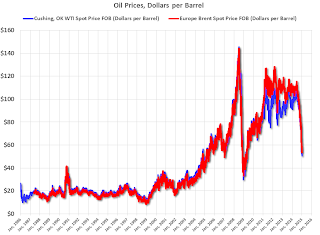
At 4.20pm GMT (11.20 am ET), West Texas Intermediate crude was trading at $50.30 a barrel, a decline of more than 4.5% from Friday's close to the lowest level since April 2009.
Brent crude, the international benchmark, was also down more than 5% to below $54 a barrel, the lowest price since May 2009.
 Click on graph for larger image
This graph shows WTI and Brent spot oil prices from the EIA. (Prices today added).
According to Bloomberg, WTI has fallen 4.5% today to $50.31 per barrel, and Brent to $53.33.
Oil prices are off about 53% from the peak last year, and if this price decline holds, there should be further declines in gasoline prices over the next couple of weeks. Nationally gasoline prices are around $2,18 per gallon, and gasoline futures are down about 6 cents per gallon today.
Reis: Office Vacancy Rate declined in Q4 to 16.7%
by Calculated Risk on 1/05/2015 08:59:00 AM
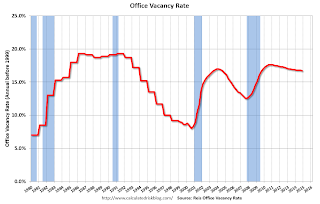
Reis released their Q4 2014 Office Vacancy survey this morning. Reis reported that the office vacancy rate declined in Q4 to 16.7% from 16.8% in Q3 2014. This is down from 16.9% in Q4 2013, and down from the cycle peak of 17.6%.
From Bloomberg: U.S. Office-Occupancy Gains Jump to a Seven-Year High
Occupied office space increased by a net 10.97 million square feet (1 million square meters) during the last three months of the year, the most since the third quarter of 2007, according to property-research firm Reis Inc. The measure, known as net absorption, jumped 28 percent in 2014 to 32.5 million square feet, also a seven-year high.
...
The nationwide vacancy rate at the end of the year was 16.7 percent, the lowest since the third quarter of 2009 and down from 16.9 percent in 2013.
...
“As long as we don’t get a random shock to the economy, and labor growth continues, vacancies should fall and rents should rise faster in 2015,” [Ryan Severino, Reis senior economist] said.
 Click on graph for larger image.
This graph shows the office vacancy rate starting in 1980 (prior to 1999 the data is annual).
Reis reported the vacancy rate was at 16.7% in Q4, down from 16.9% in Q4 2014. The vacancy rate peaked in this cycle at 17.6% in Q3 and Q4 2010, and Q1 2011.
Net absorption is picking up, but there will not be a significant pickup in new construction until the vacancy rate falls much further.
Office vacancy data courtesy of Reis.


