 RSS Feed
 by Calculated Risk on 12/16/2014 12:45:00 PM
Tuesday, December 16, 2014
DataQuick: "Southern California November Home Sales Fall Sharply"
From DataQuick: Southern California November Home Sales Fall Sharply; Median Sale Price Holds Steady Again
Home sales dropped to the lowest level for the month of November in seven years, the result of a relatively low number of days for recording deals, as well as fewer investor purchases and other market factors. ... A total of 15,643 new and resale houses and condos sold in Los Angeles, Riverside, San Diego, Ventura, San Bernardino and Orange counties in November 2014. That was down 18.8 percent from 19,271 sales in October, and down 9.5 percent from 17,283 sales in November 2013, according to CoreLogic DataQuick data.The NAR is scheduled to release existing home sales for November on Monday, December 22nd. Housing economist Tom Lawler is forecasting the NAR will report November sales of 4.93 million SAAR.
On average, Southern California sales have fallen 8.4 percent between October and November since 1988, when CoreLogic DataQuick data began. It’s likely that this November’s sales decline from October was especially sharp because of a calendar issue: There were only 17 days on which home sales could be recorded at county recorders' offices this November, compared with 22 or 23 days in October, depending on the county. Over the last decade, there has been an average of about 19 days for such recordings in the month of November. ...
"Southern California home sales are closing on a low note in 2014,” said Andrew LePage, data analyst for CoreLogic DataQuick. “Inventory still lags demand in many markets and traditional buyers haven’t filled the void left by the investors who’ve pulled out. Among would-be buyers, affordability and mortgage availability remain as hurdles, as do concerns about job security and the direction of the housing market. But there are reasons to expect more housing demand ahead. According to recent data from the federal government, job and income growth has improved. Many people who became renters after a foreclosure or short sale over the past seven years will want to buy again. And potential home buyers sitting on the fence might be tempted to jump off if they see evidence that mortgage rates will spike from today’s exceptionally low levels.”
...
Foreclosure resales represented 5.3 percent of the Southern California resale market in November. That was up from a revised 4.9 percent in October and down from 6.3 percent a year earlier. In recent months the foreclosure resale rate has been the lowest since early 2007. In the current cycle, foreclosure resales hit a high of 56.7 percent in February 2009. Foreclosure resales are purchased homes that had been previously foreclosed upon in the prior 12 months.
Short sales made up an estimated 6.2 percent of resales in November, up from a revised 6.0 percent in October and down from 10.5 percent in November 2013. Short sales are transactions in which the sale price fell short of what was owed on the property.
emphasis added
Comments on November Housing Starts
by Calculated Risk on 12/16/2014 10:40:00 AM
A year ago, for November 2013, housing starts were reported at 1.091 million on a SAAR basis (seasonally adjusted annual rate), up 29.6% from November 2012. Starts in November 2013 have since been revised up to 1.105 million. That huge increase in starts was probably one reason that many analysts, myself included, were overly optimistic for housing starts in 2014.
This year total starts in November were reported at 1.028 million SAAR, down 7.0% from a year ago. That sounds weak, but actually starts in the 2nd half of 2014 have averaged 1.032 million, up 10.1% from the 937 thousand during the same period last year - including that strong November in 2013!
In early 2014, housing starts were very weak - down year-over-year in Q1 - but starts have picked up in the 2nd half.
A few numbers: There were 927 thousand total housing starts during the first eleven months of 2014 (not seasonally adjusted, NSA), up 8.2% from the 857 thousand during the same period of 2013. Single family starts are up 4.4%, and multifamily starts up 16.6%. The key weakness has been in single family starts.
The following table shows the annual housing starts since 2005, and the percent change from the previous year (estimates for 2014). The housing recovery has slowed in 2014, especially for single family starts. However I expect further growth in starts over the next several years.
| Housing Starts (000s) and Annual Change | ||||
|---|---|---|---|---|
| Total | Total % Change | Single | Single % Change | |
| 2005 | 2,068.3 | 5.8% | 1,715.8 | 6.5% |
| 2006 | 1,800.9 | -12.9% | 1,465.4 | -14.6% |
| 2007 | 1,355.0 | -24.8% | 1,046.0 | -28.6% |
| 2008 | 905.5 | -33.2% | 622.0 | -40.5% |
| 2009 | 554.0 | -38.8% | 445.1 | -28.4% |
| 2010 | 586.9 | 5.9% | 471.2 | 5.9% |
| 2011 | 608.8 | 3.7% | 430.6 | -8.6% |
| 2012 | 780.6 | 28.2% | 535.3 | 24.3% |
| 2013 | 924.9 | 18.5% | 617.6 | 15.4% |
| 20141 | 997.0 | 7.8% | 644.0 | 4.3% |
| 1Estimate for 2014 | ||||
This graph shows the month to month comparison between 2013 (blue) and 2014 (red). Starts in 2014 were above the same month in 2013 for seven consecutive months prior to November.
 Click on graph for larger image.
December will be another difficult year-over-year comparison, but I expect to see solid year-over-year growth in Q1 2015.
Below is an update to the graph comparing multi-family starts and completions. Since it usually takes over a year on average to complete a multi-family project, there is a lag between multi-family starts and completions. Completions are important because that is new supply added to the market, and starts are important because that is future new supply (units under construction is also important for employment).
These graphs use a 12 month rolling total for NSA starts and completions.
 The blue line is for multifamily starts and the red line is for multifamily completions.
 The rolling 12 month total for starts (blue line) increased steadily over the last few years, and completions (red line) have lagged behind - but completions have been catching up (more deliveries), and will continue to follow starts up (completions lag starts by about 12 months).
Most of the growth in multi-family starts is probably behind us - although I expect solid multi-family starts for a few more years (based on demographics).
 The second graph shows single family starts and completions. It usually only takes about 6 months between starting a single family home and completion - so the lines are much closer. The blue line is for single family starts and the red line is for single family completions.
Note the exceptionally low level of single family starts and completions. The "wide bottom" was what I was forecasting several years ago, and now I expect several years of increasing single family starts and completions.
Housing Starts decrease to 1.028 Million Annual Rate in November
by Calculated Risk on 12/16/2014 08:30:00 AM
From the Census Bureau: Permits, Starts and Completions
Housing Starts:
Privately-owned housing starts in November were at a seasonally adjusted annual rate of 1,028,000. This is 1.6 percent below the revised October estimate of 1,045,000 and is 7.0 percent below the November 2013 rate of 1,105,000.
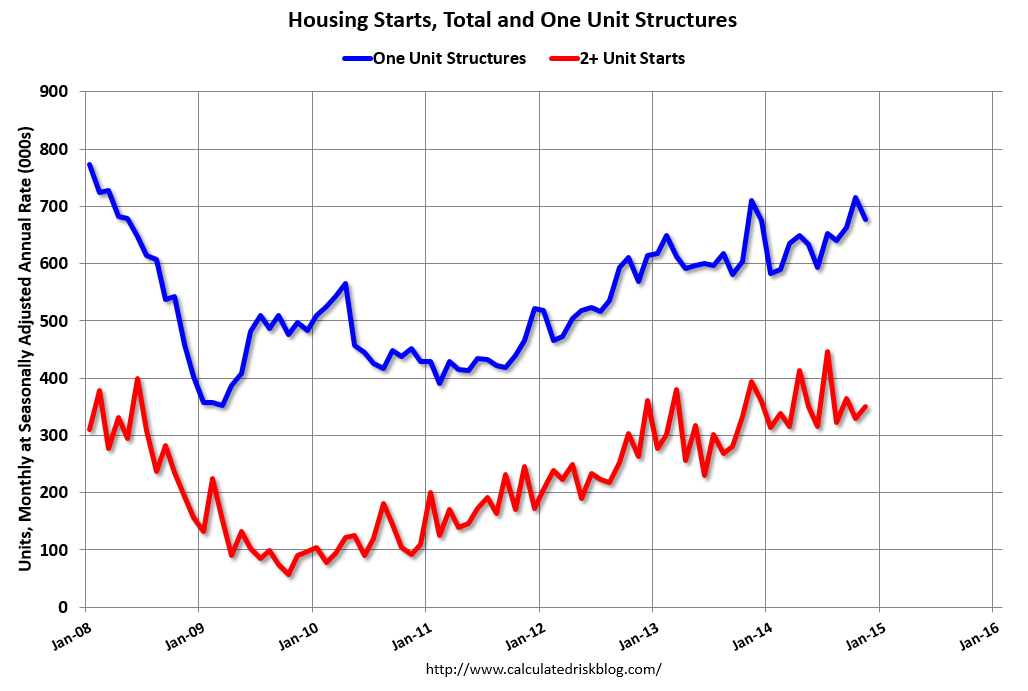
Single-family housing starts in November were at a rate of 677,000; this is 5.4 percent below the revised October figure of 716,000. The November rate for units in buildings with five units or more was 340,000.
emphasis added
Building Permits:
Privately-owned housing units authorized by building permits in November were at a seasonally adjusted annual rate of 1,035,000. This is 5.2 percent below the revised October rate of 1,092,000 and is 0.2 percent below the November 2013 estimate of 1,037,000.
Single-family authorizations in November were at a rate of 639,000; this is 1.2 percent below the revised October figure of 647,000. Authorizations of units in buildings with five units or more were at a rate of 367,000 in November.
 Click on graph for larger image.
The first graph shows single and multi-family housing starts for the last several years.
Multi-family starts (red, 2+ units) increased in November (Multi-family is volatile month-to-month). Multi-family starts are down 11% year-over-year because there was a large increase in starts last November.
Single-family starts (blue) decreased in November.
The second graph shows total and single unit starts since 1968.
 The second graph shows the huge collapse following the housing bubble, and that housing starts have been increasing after moving sideways for about two years and a half years.
 This was below expectations of 1.038 million starts in November, however October was revised up by 36 thousand (annual rate), so overall this was a decent report. The comparison to last year was difficult because of the large increase in starts in November 2013 (that probably was one of the reasons many analysts were too optimistic for 2014). I'll have more later ...
Monday, December 15, 2014
Tuesday: Housing Starts
by Calculated Risk on 12/15/2014 08:32:00 PM
Two related articles ...
From the NY Times: Russia’s Central Bank Abruptly Raises Key Rate to 17%
With Russia scrambling to contain a currency crisis, the country’s central bank, in a surprise middle-of-the-night move, increased its key interest rate to 17 percent, from 10.5 percent.From the WSJ: Oil Prices Fall to Fresh Lows
...
The rate increase came after the ruble plummeted yet again on Monday, by more than 10 percent, to around 64 per dollar. The ruble has lost nearly half its value this year.
Oil for January delivery fell $1.90, or 3.3%, to close at $55.91 a barrel, the lowest level since May 2009 on the New York Mercantile Exchange.There is more to the ruble collapse than declining oil prices, but it is a huge factor.
Brent crude, the global benchmark, slid 1.3% to $61.06 a barrel, the lowest level since July 2009, on ICE Futures Europe.
Tuesday:
• At 8:30 AM ET, Housing Starts for November. Total housing starts were at 1.009 million (SAAR) in October. Single family starts were at 696 thousand SAAR in October. The consensus is for total housing starts to increase to 1.038 million (SAAR) in November.
Lawler: Updated Table of Distressed Sales and Cash buyers for Selected Cities in November
by Calculated Risk on 12/15/2014 06:25:00 PM
Economist Tom Lawler sent me the updated table below of short sales, foreclosures and cash buyers for a few selected cities in November.
On distressed: Total "distressed" share is down in these markets mostly due to a decline in short sales (the Mid-Atlantic and Orlando were unchanged).
Short sales are down significantly in these areas.
Foreclosures are up in several areas (working through the logjam).
The All Cash Share (last two columns) is declining year-over-year. As investors pull back, the share of all cash buyers will probably continue to decline.
| Short Sales Share | Foreclosure Sales Share | Total "Distressed" Share | All Cash Share | |||||
|---|---|---|---|---|---|---|---|---|
| Nov-14 | Nov-13 | Nov-14 | Nov-13 | Nov-14 | Nov-13 | Nov-14 | Nov-13 | |
| Las Vegas | 9.5% | 21.0% | 8.7% | 7.0% | 18.2% | 28.0% | 32.8% | 43.7% |
| Reno** | 6.0% | 17.0% | 6.0% | 6.0% | 12.0% | 23.0% | ||
| Phoenix | 4.1% | 7.8% | 5.7% | 8.0% | 9.7% | 15.8% | 28.0% | 34.0% |
| Sacramento | 6.1% | 11.0% | 5.4% | 4.6% | 11.5% | 15.6% | 16.9% | 25.0% |
| Minneapolis | 3.1% | 5.0% | 10.2% | 16.9% | 13.4% | 21.9% | ||
| Mid-Atlantic | 4.7% | 7.5% | 11.0% | 8.1% | 15.7% | 15.7% | 19.1% | 19.6% |
| Orlando | 6.2% | 13.7% | 27.8% | 20.3% | 34.0% | 34.0% | 42.1% | 46.2% |
| So. California* | 6.2% | 10.5% | 5.3% | 6.3% | 11.5% | 16.8% | 23.9% | 28.1% |
| Northeast Florida | 29.7% | 38.1% | ||||||
| Chicago (City) | 20.2% | 32.8% | ||||||
| Hampton Roads | 20.4% | 26.9% | ||||||
| Toledo | 35.4% | 37.2% | ||||||
| Tucson | 26.3% | 32.2% | ||||||
| Des Moines | 19.3% | 19.9% | ||||||
| Peoria | 19.7% | 21.8% | ||||||
| Georgia*** | 26.5% | N/A | ||||||
| Omaha | 21.1% | 21.6% | ||||||
| Memphis* | 15.1% | 20.5% | ||||||
| Springfield IL** | 11.8% | 17.6% | ||||||
| *share of existing home sales, based on property records **Single Family Only ***GAMLS | ||||||||


