by Calculated Risk on 9/22/2014 11:55:00 AM
Monday, September 22, 2014
A Few Comments on August Existing Home Sales
The most important number in the NAR report each month is inventory. This morning the NAR reported that inventory was up 4.5% year-over-year in August. It is important to note that the NAR inventory data is "noisy" and difficult to forecast based on other data.
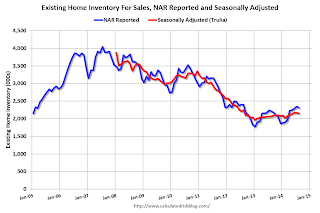
The headline NAR inventory number is not seasonally adjusted, even though there is a clear seasonal pattern. Trulia chief economist Jed Kolko has sent me the seasonally adjusted inventory. NOTE: The NAR does provide a seasonally adjusted months-of-supply, although that is in the supplemental data.

This shows that inventory bottomed in January 2013 (on a seasonally adjusted basis), and inventory is now up about 9.7% from the bottom. On a seasonally adjusted basis, inventory was down 0.1% in August compared to July.
Important: The NAR reports active listings, and although there is some variability across the country in what is considered active, many "contingent short sales" are not included. "Contingent short sales" are strange listings since the listings were frequently NEVER on the market (they were listed as contingent), and they hang around for a long time - they are probably more closely related to shadow inventory than active inventory. However when we compare inventory to 2005, we need to remember there were no "short sale contingent" listings in 2005. In the areas I track, the number of "short sale contingent" listings is also down sharply year-over-year.
And it appears investor buying is declining. From the NAR:
All-cash sales were 23 percent of transactions in August, dropping for the second consecutive month (29 percent in July) and representing the lowest overall share since December 2009 (22 percent). Individual investors, who account for many cash sales, purchased 12 percent of homes in August, down from 16 percent last month and 17 percent in August 2013. Sixty-four percent of investors paid cash in August.And another key point: The NAR reported total sales were down 5.3% from August 2013, but normal equity sales were probably up from July 2013, and distressed sales down sharply. From the NAR (from a survey that is far from perfect):
Distressed homes – foreclosures and short sales – represented 8 percent of August sales, remaining in the single-digits for the second straight month and down from 12 percent a year ago. Six percent of August sales were foreclosures and 2 percent were short sales.Last year in August the NAR reported that 12% of sales were distressed sales.
A rough estimate: Sales in August 2013 were reported at 5.33 million SAAR with 12% distressed. That gives 640 thousand distressed (annual rate), and 4.69 million equity / non-distressed. In August 2014, sales were 5.05 million SAAR, with 8% distressed. That gives 404 thousand distressed - a decline of over 35% from August 2013 - and 4.65 million equity. Although this survey isn't perfect, this suggests distressed sales were down sharply - and normal sales flat or down slightly.
The following graph shows existing home sales Not Seasonally Adjusted (NSA).
 Click on graph for larger image.
Sales NSA in August (red column) were below the level of sales in August 2013, and above sales for 2008 through 2012.
Overall this was a solid report.
Earlier:
• Existing Home Sales in August: 5.05 million SAAR, Inventory up 4.5% Year-over-year
Existing Home Sales in August: 5.05 million SAAR, Inventory up 4.5% Year-over-year
by Calculated Risk on 9/22/2014 10:00:00 AM
The NAR reports: Existing-Home Sales Slightly Lose Momentum in August as Investor Activity Declines
Total existing-home sales, which are completed transactions that include single-family homes, townhomes, condominiums and co-ops, decreased 1.8 percent to a seasonally adjusted annual rate of 5.05 million in August from a slight downwardly-revised 5.14 million in July. Sales are at the second-highest pace of 2014, but remain 5.3 percent below the 5.33 million-unit level from last August, which was also the second-highest sales level of 2013. ...
Total housing inventory at the end of August declined 1.7 percent to 2.31 million existing homes available for sale, which represents a 5.5-month supply at the current sales pace. However, unsold inventory is 4.5 percent higher than a year ago, when there were 2.21 million existing homes available for sale.
 Click on graph for larger image.
This graph shows existing home sales, on a Seasonally Adjusted Annual Rate (SAAR) basis since 1993.
Sales in August (5.05 million SAAR) were 1.8% lower than last month, and were 5.3% below the August 2013 rate.
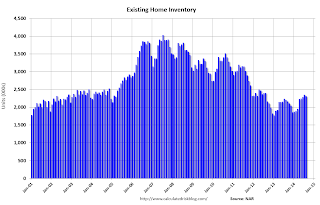
The second graph shows nationwide inventory for existing homes.
 According to the NAR, inventory decreased to 2.31 million in August from 2.35 million in July. Headline inventory is not seasonally adjusted, and inventory usually increases from the seasonal lows in December and January, and peaks in mid-to-late summer.
The third graph shows the year-over-year (YoY) change in reported existing home inventory and months-of-supply. Since inventory is not seasonally adjusted, it really helps to look at the YoY change. Note: Months-of-supply is based on the seasonally adjusted sales and not seasonally adjusted inventory.
 Inventory increased 4.5% year-over-year in August compared to August 2013.
 Months of supply was at 5.5 months in August.
This was below expectations of sales of 5.18 million. For existing home sales, the key number is inventory - and inventory is still low, but up year-over-year. I'll have more later ...
Chicago Fed: "Index shows economic growth decelerated in August"
by Calculated Risk on 9/22/2014 08:30:00 AM
The Chicago Fed released the national activity index (a composite index of other indicators): Index shows economic growth decelerated in August
Led by declines in production-related indicators, the Chicago Fed National Activity Index (CFNAI) decreased to –0.21 in August from +0.26 in July. Two of the four broad categories of indicators that make up the index decreased from July, and two of the four categories made negative contributions to the index in August.This graph shows the Chicago Fed National Activity Index (three month moving average) since 1967.
The index’s three-month moving average, CFNAI-MA3, decreased to +0.07 in August from +0.20 in July, marking its sixth consecutive reading above zero. August’s CFNAI-MA3 suggests that growth in national economic activity was somewhat above its historical trend. The economic growth reflected in this level of the CFNAI-MA3 suggests limited inflationary pressure from economic activity over the coming year.
emphasis added
 Click on graph for larger image.
This suggests economic activity was slightly above the historical trend in August (using the three-month average).
According to the Chicago Fed:
What is the National Activity Index? The index is a weighted average of 85 indicators of national economic activity drawn from four broad categories of data: 1) production and income; 2) employment, unemployment, and hours; 3) personal consumption and housing; and 4) sales, orders, and inventories.
A zero value for the index indicates that the national economy is expanding at its historical trend rate of growth; negative values indicate below-average growth; and positive values indicate above-average growth.
Sunday, September 21, 2014
Monday: Existing Home Sales
by Calculated Risk on 9/21/2014 08:38:00 PM
Another excellent article from Nick Timiraos at the WSJ: Should Mortgage Lending Standards Ease?
Easy credit fueled the home-price bubble of the past decade, which spurred overbuilding of homes and boosted consumer spending on everything from cars to college educations. Mortgage investors suffered huge losses after prices collapsed, and private lending markets have struggled to revive. Banks now are sharply limiting their mortgage offerings.Monday:
Subprime auto lending, by comparison, contracted sharply during the recession but has roared back—at a pace nearly four times that of prime lending over the past four years.
Auto lending has rebounded in part because investors didn't take the drubbing that mortgage investors did. Loans are smaller, cars can be repossessed faster than homes when borrowers default, and the collateral is easier to value. Car sales have also been fueled by an aging fleet that has resulted in pent-up demand.
• At 8:30 AM ET, the Chicago Fed National Activity Index for August. This is a composite index of other data.
• At 10:00 AM, Existing Home Sales for August from the National Association of Realtors (NAR). The consensus is for sales of 5.18 million on seasonally adjusted annual rate (SAAR) basis. Sales in July were at a 5.15 million SAAR. Economist Tom Lawler estimates the NAR will report sales of 5.12 million SAAR.
Weekend:
• Schedule for Week of September 21st
From CNBC: Pre-Market Data and Bloomberg futures: the S&P futures are down slightly and DOW futures are up slightly (fair value).
Oil prices were up over the last week with WTI futures at $92.41 per barrel and Brent at $98.08 per barrel. A year ago, WTI was at $104, and Brent was at $110 - so prices are down 10%+ year-over-year.
Below is a graph from Gasbuddy.com for nationwide gasoline prices. Nationally prices are around $3.35 per gallon (down almost 15 cents from a year ago). If you click on "show crude oil prices", the graph displays oil prices for WTI, not Brent; gasoline prices in most of the U.S. are impacted more by Brent prices.
| Orange County Historical Gas Price Charts Provided by GasBuddy.com |
Hotels: Occupancy up 4.5%, RevPAR up 11.8% Year-over-Year
by Calculated Risk on 9/21/2014 12:13:00 PM
From HotelNewsNow.com: STR: US results for week ending 13 September
The U.S. hotel industry recorded positive results in the three key performance measurements during the week of 7-13 September 2014, according to data from STR.Note: ADR: Average Daily Rate, RevPAR: Revenue per Available Room.
In year-over-year measurements, the industry’s occupancy rate rose 4.5 percent to 68.0 percent. Average daily rate increased 6.9 percent to finish the week at US$117.73. Revenue per available room for the week was up 11.8 percent to finish at US$80.04.
emphasis added
The following graph shows the seasonal pattern for the hotel occupancy rate using the four week average.
There is always a dip in occupancy after the summer (less leisure travel), and business travel should pick up soon.
 Click on graph for larger image.
The red line is for 2014, blue is the median, and black is for 2009 - the worst year since the Great Depression for hotels. Purple is for 2000.
The 4-week average of the occupancy rate is solidly above the median for 2000-2007, and is at about the level as for the same week in 2000 (the previous high).
Right now it looks like 2014 will be the best year since 2000 for hotels. Since it takes some time to plan and build hotels, I expect 2015 will be a record year for hotel occupancy. Note: Smith Travel analysts say that supply growth will pickup next year, but remain relatively slow, "hotel supply growth in the United States is forecast to be 1% this year and 1.3% in 2015".
Data Source: Smith Travel Research, Courtesy of HotelNewsNow.com


