by Calculated Risk on 6/03/2014 12:15:00 PM
Tuesday, June 03, 2014
Vehicle Sales in May: Solid Early Reports
I'll post a graph of monthly vehicle sales when after all the automakers report (usually between 3 and 4 PM ET). The consensus is for light vehicle sales to increase to 16.1 million SAAR in May from just under 16.0 million in April (Seasonally Adjusted Annual Rate).
Here are a few articles that suggest sales were solid in May (there was one more selling day in May 2014 compared to May 2013).
From MarketWatch: General Motors U.S. sales jump 13% in May
GM said it sold 284,694 total vehicles in May, up from 252,894 a year earlier. ... GM called the results its best total monthly sales figure since August 2008.From MarketWatch: Chrysler's U.S. sales jump 17% in May
Chrysler, a unit of Fiat Chrysler Automobiles, sold 194,421 vehicles in May, up from 166,596 a year earlier. The company said it enjoyed its best May sales since 2007.From MarketWatch: Ford sales rise 3% in May
Ford Motor Co. reported Tuesday it sold 254,084 cars and pickup-truck in the United States in May, up 3% from a year ago. ... It was Ford's best May in 10 years
CoreLogic: House Prices up 10.5% Year-over-year in April
by Calculated Risk on 6/03/2014 09:14:00 AM
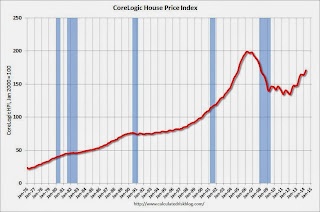
Notes: This CoreLogic House Price Index report is for April. The recent Case-Shiller index release was for March. The CoreLogic HPI is a three month weighted average and is not seasonally adjusted (NSA).
From CoreLogic: CoreLogic Reports Home Prices Rise by 10.5 Percent Year Over Year in April
Home prices nationwide, including distressed sales, increased 10.5 percent in April 2014 compared to April 2013. This change represents 26 months of consecutive year-over-year increases in home prices nationally. On a month-over-month basis, home prices nationwide, including distressed sales, increased 2.1 percent in April 2014 compared to March 2014.
Excluding distressed sales, home prices nationally increased 8.3 percent in April 2014 compared to April 2013 and 1.1 percent month over month compared to March 2014. Distressed sales include short sales and real estate owned (REO) transactions.
“The weakness in home sales that began a few months ago is clearly signaling a slowdown in price appreciation,” said Sam Khater, deputy chief economist for CoreLogic. “The 10.5 percent increase in April, compared to a year earlier, was the slowest rate of appreciation in 14 months.”
emphasis added
 Click on graph for larger image.
 This graph shows the national CoreLogic HPI data since 1976. January 2000 = 100.
The index was up 2.1% in April, and is up 10.5% over the last year.
This index is not seasonally adjusted, so a strong month-to-month gain was expected for April.
 The second graph is from CoreLogic. The year-over-year comparison has been positive for twenty six consecutive months suggesting house prices bottomed early in 2012 on a national basis (the bump in 2010 was related to the tax credit).
I expect the year-over-year increases to continue to slow.
Monday, June 02, 2014
Tuesday: Vehicle Sales
by Calculated Risk on 6/02/2014 08:25:00 PM
From Emily Badger at the WaPo:
Census data released Monday on the characteristics of new single-family housing construction confirms that the median size of a new pad in America is bigger than it's ever been ... In 2013, the median size of a new single-family home completed in the United States was 2,384 square feet (the average, not surprisingly, was tugged even higher by the mega-mega home: 2,598 square feet). That median is above the pre-crash peak of 2,277 square feet in 2007, and it dwarfs the size of homes we were building back in 1973 (median size then: 1,525 square feet)....Looks like extra bathrooms are very popular.
What, then, do we want all of this room for? What's particularly striking in the Census Bureau's historic data on new housing characteristics is the growth of what would be luxuries for many households: fourth bedrooms, third bathrooms, three-car garages.
Tuesday:
• All day: Light vehicle sales for May. The consensus is for light vehicle sales to increase to 16.1 million SAAR in May from 16.0 million in April (Seasonally Adjusted Annual Rate).
• At 10:00 AM, Manufacturers' Shipments, Inventories and Orders (Factory Orders) for April. The consensus is for a 0.5% increase in April orders.
Weekly Update: Housing Tracker Existing Home Inventory up 10.5% year-over-year on June 2nd
by Calculated Risk on 6/02/2014 06:23:00 PM
Here is another weekly update on housing inventory ...
There is a clear seasonal pattern for inventory, with the low point for inventory in late December or early January, and then usually peaking in mid-to-late summer.
The Realtor (NAR) data is monthly and released with a lag (the most recent data was for April). However Ben at Housing Tracker (Department of Numbers) has provided me some weekly inventory data for the last several years.
 Click on graph for larger image.
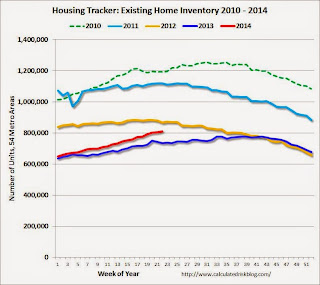
This graph shows the Housing Tracker reported weekly inventory for the 54 metro areas for 2010, 2011, 2012, 2013 and 2014.
In 2011 and 2012, inventory only increased slightly early in the year and then declined significantly through the end of each year.
In 2013 (Blue), inventory increased for most of the year before declining seasonally during the holidays. Inventory in 2013 finished up 2.7% YoY compared to 2012.
Inventory in 2014 (Red) is now 10.5% above the same week in 2013.
Inventory is still very low - still below the level in 2012 (yellow) when prices started increasing - but this increase in inventory should slow house price increases.
Note: One of the key questions for 2014 will be: How much will inventory increase? My guess was inventory will be up 10% to 15% year-over-year at the end of 2014. Inventory may increase a little more than I expected!
ISM Correction: ISM Manufacturing index increased in May to 55.4
by Calculated Risk on 6/02/2014 02:16:00 PM
Note: The ISM made a seasonal adjustment error in their release this morning. The index was corrected twice, and is now reported to have increased to 55.4%, not decreased to 53.2% as was initially reported.
The ISM manufacturing index suggests faster expansion in May than in April. The PMI was at 55.4% in May, up from 54.9% in April. The employment index was at 52.8%, down from 54.7% in March, and the new orders index was at 56.9%, up from 55.1% in April.
From the Institute for Supply Management: May 2014 Manufacturing ISM® Report On Business® CORRECTION
ISM® has discovered an error in its software programming for calculating the May 2014 Manufacturing PMI® that was released at 10 a.m. ET this morning.
“We apologize for this error. We have recalculated and confirmed that the actual index indicates that the economy is accelerating,” said Bradley J. Holcomb, CPSM, CPSD, chair of the Institute for Supply Management® (ISM®) Manufacturing Business Survey Committee. “Our research team is analyzing our internal processes to ensure that this doesn’t happen again,” he added.
“The May PMI® registered 55.4 percent, an increase of 0.5 percentage point from April’s reading of 54.9 percent, indicating expansion in manufacturing for the 12th consecutive month. The New Orders Index registered 56.9 percent, an increase of 1.8 percentage points from the 55.1 percent reading in April, indicating growth in new orders for the 12th consecutive month. The Production Index registered 61.0 percent, 5.3 percentage points above the April reading of 55.7 percent. Employment grew for the 11th consecutive month, registering 52.8 percent, a decrease of 1.9 percentage points below April’s reading of 54.7 percent. The Supplier Deliveries Index registered 53.2 percent, 2.7 percentage points below the April reading of 55.9 percent. Comments from the panel reflect generally steady growth, but note some areas of concern regarding raw materials pricing and supply tightness and shortages.”
emphasis added
 Click on graph for larger image.
Here is a long term graph of the ISM manufacturing index.
This was close to expectations of 55.5%.
Construction Spending increased 0.2% in April
by Calculated Risk on 6/02/2014 11:24:00 AM
The Census Bureau reported that overall construction spending increased in April:
The U.S. Census Bureau of the Department of Commerce announced today that construction spending during April 2014 was estimated at a seasonally adjusted annual rate of $953.5 billion, 0.2 percent above the revised March estimate of $951.6 billion. The April figure is 8.6 percent above the April 2013 estimate of $878.4 billion.Private spending was mostly unchanged and public spending increased in April:
Spending on private construction was at a seasonally adjusted annual rate of $686.5 billion, nearly the same as the revised March estimate of $686.8 billion. ...
In April, the estimated seasonally adjusted annual rate of public construction spending was $267.0 billion, 0.8 percent above the revised March estimate of $264.8 billion.
emphasis added
 Click on graph for larger image.
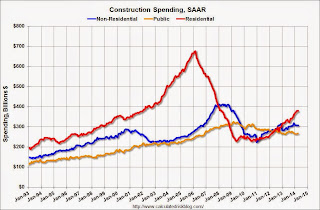
This graph shows private residential and nonresidential construction spending, and public spending, since 1993. Note: nominal dollars, not inflation adjusted.
Private residential spending is 44% below the peak in early 2006, and up 66% from the post-bubble low.
Non-residential spending is 26% below the peak in January 2008, and up about 37% from the recent low.
Public construction spending is now 18% below the peak in March 2009 and about 1% above the post-recession low.
 The second graph shows the year-over-year change in construction spending.
On a year-over-year basis, private residential construction spending is now up 17%. Non-residential spending is up 6% year-over-year. Public spending is up 1% year-over-year.
Looking forward, all categories of construction spending should increase in 2014. Residential spending is still very low, non-residential is starting to pickup, and public spending is probably near a bottom.
Note: Public construction spending is at the lowest level since 2006 (lowest since 2001 adjusted for inflation). Not investing more in infrastructure is probably one of the major policy failures of the last 5+ years.
ISM Manufacturing index (ISM Correction)
by Calculated Risk on 6/02/2014 10:06:00 AM
2nd UPDATE: The ISM has announced an error in their release this morning. The index increased to 55.4%, not decreased to 53.2% as reported below. (initial correction was to 56.0%)
The ISM manufacturing index suggests slower expansion in May than in April. The PMI was at 53.2% in May, down from 54.9% in April. The employment index was at 51.9%, down from 54.7% in March, and the new orders index was at 53.3%, down from 55.1% in April.
From the Institute for Supply Management: May 2014 Manufacturing ISM Report On Business®
Economic activity in the manufacturing sector expanded in May for the 12th consecutive month, and the overall economy grew for the 60th consecutive month, say the nation's supply executives in the latest Manufacturing ISM® Report On Business®.
The report was issued today by Bradley J. Holcomb, CPSM, CPSD, chair of the Institute for Supply Management® (ISM®) Manufacturing Business Survey Committee. "The May PMI® registered 53.2 percent, a decrease of 1.7 percentage points from April's reading of 54.9 percent, indicating expansion in manufacturing for the 12th consecutive month. The New Orders Index registered 53.3 percent, a decrease of 1.8 percentage points from the 55.1 percent reading in April, indicating growth in new orders for the 12th consecutive month. The Production Index registered 55.2 percent, 0.5 percentage point below the April reading of 55.7 percent. Employment grew for the 11th consecutive month, registering 51.9 percent, a decrease of 2.8 percentage points below April's reading of 54.7 percent. Comments from the panel reflect generally steady growth, but note some areas of concern regarding raw materials pricing and supply tightness and shortages."
emphasis added
 Click on graph for larger image.
Here is a long term graph of the ISM manufacturing index.
This was below expectations of 55.5%.
Mortgage Monitor: "Nearly 2 million modified mortgages face interest rate resets"
by Calculated Risk on 6/02/2014 08:05:00 AM
Black Knight Financial Services (BKFS, formerly the LPS Data & Analytics division) released their Mortgage Monitor report for April today. According to BKFS, 5.62% of mortgages were delinquent in April, up from 5.52% in March. BKFS reports that 2.02% of mortgages were in the foreclosure process, down from 3.17% in April 2013.
This gives a total of 7.64% delinquent or in foreclosure. It breaks down as:
• 1,634,000 properties that are 30 or more days, and less than 90 days past due, but not in foreclosure.
• 1,187,000 properties that are 90 or more days delinquent, but not in foreclosure.
• 1,016,000 loans in foreclosure process.
For a total of 3,837,000 loans delinquent or in foreclosure in April. This is down from 4,699,000 in April 2013.

This graph from BKFS shows the number of modified loans that face interest rate resets by date of modification. From BKFS:
An analysis of mortgage performance data showed that, as of April, there were approximately 2 million modified mortgages facing interest rate resets. Furthermore, more than 40 percent of those loan modifications are currently underwater.There is much more in the mortgage monitor.
“We have seen a continual reduction in the number of underwater borrowers at the national level for some time now, but modified loans show a different picture,” said Kostya Gradushy, Black Knight’s manager of Loan Data and Customer Analytics. “While the national negative equity rate as of April stands at 9.4 percent of active mortgages, the share of underwater modified loans facing interest rate resets is much higher -- over 40 percent. In addition, another 18 percent of modified borrowers have 9 percent equity or less in their homes. Given that the data has shown quite clearly that equity -- or the lack thereof -- is one of the primary drivers of mortgage defaults, these resets may indeed pose an increased risk in the years ahead."
emphasis added
Sunday, June 01, 2014
Monday: ISM Manufacturing Survey, Construction Spending
by Calculated Risk on 6/01/2014 08:21:00 PM
From Jon Hilsenrath at the WSJ: Heloc Payment Jump to Take Bite Out of Consumer Spending
At issue are home-equity lines of credit, known as Helocs, which allow homeowners to tap their equity to fund home improvement, college tuitions and other expenses. Those loans typically let borrowers make interest-only payments for the first 10 years before requiring principal payments as well.Weekend:
That reckoning will come this year for an estimated 817,000 borrowers owing more than $23 billion in Helocs, more than double last year's level, according to estimates by Equifax, the credit-reporting firm, and the Office of the Comptroller of the Currency. An average of about $50 billion in loans will reset in each of the next three years.
• Schedule for Week of June 1st
Monday:
• At 10:00 AM ET, the ISM Manufacturing Index for May. The consensus is for an increase to 55.5. The ISM manufacturing index indicated expansion in April at 54.9%. The employment index was at 54.7%, and the new orders index was at 55.1%.
• Also at 10:00 AM: Construction Spending for April. The consensus is for a 0.7% increase in construction spending.
From CNBC: Pre-Market Data and Bloomberg futures: the S&P futures are down slightly and DOW futures are up slightly (fair value).
Oil prices were mixed over the last week with WTI futures at $102.97 per barrel and Brent at $109.52 per barrel.
Below is a graph from Gasbuddy.com for nationwide gasoline prices. Nationally prices are around $3.65 per gallon (at about below the level of a year ago). If you click on "show crude oil prices", the graph displays oil prices for WTI, not Brent; gasoline prices in most of the U.S. are impacted more by Brent prices.
| Orange County Historical Gas Price Charts Provided by GasBuddy.com |
Restaurant Performance Index increases in April, Strongest since May 2013
by Calculated Risk on 6/01/2014 11:57:00 AM
From the National Restaurant Association: Restaurant Performance Index Gained 0.3 Percent in April as Sales and Customer Traffic Continued to Rise
Fueled by improving same-store sales and customer traffic and a positive outlook among restaurant operators, the National Restaurant Association’s Restaurant Performance Index (RPI) rose for the second consecutive month. The RPI – a monthly composite index that tracks the health of and outlook for the U.S. restaurant industry – stood at 101.7 in April, up 0.3 percent from March and the strongest level since May 2013. In addition, the RPI stood above 100 for the 14th consecutive month, which signifies expansion in the index of key industry indicators.
“The recent rise in the RPI was fueled by improvements in same-store sales and customer traffic, which are back on a positive trajectory after the winter soft patch,” said Hudson Riehle, senior vice president of the Research and Knowledge Group for the Association. “In addition, restaurant operators have an optimistic outlook for business conditions in the months ahead, which is reflected by the expectations component of the RPI rising to its highest level in two years.”
...
For the second consecutive month, a majority of restaurant operators reported higher same-store sales. ... Restaurant operators reported a net gain in customer traffic levels for the second straight month, after registering declines in the previous three months.
emphasis added
 Click on graph for larger image.
The index increased to 101.7 in April, up from 101.4 in March. (above 100 indicates expansion).
Restaurant spending is discretionary, so even though this is "D-list" data, I like to check it every month - and this is a fairly solid reading.


