by Calculated Risk on 11/19/2012 09:06:00 PM
Monday, November 19, 2012
Tuesday: Housing Starts, Bernanke on Economy and Policy
Tuesday:
• At 8:30 AM, the Census Bureau will release Housing Starts for October. The consensus is for total housing starts to decline to 840,000 (SAAR) in October, down from 872,000 in September. Goldman Sachs is forecasting a decline in starts to 840,000, and Merrill Lynch is forecasting 815,000.
• At 10:00 AM, the BLS will release the Regional and State Employment and Unemployment report for October 2012.
• At 12:15 PM, Fed Chairman Ben Bernanke will speak at the Economic Club of New York, New York, New York, The Economic Recovery and Economic Policy. Bernanke will most likely avoid specific policies, but urge policymakers to put the budget on a "sustainable long-run path" and "to avoid unnecessarily impeding the current economic recovery".
Both quotes are from a speech Bernanke gave in June when he also said: "Fortunately, avoiding the fiscal cliff and achieving long-term fiscal sustainability are fully compatible and mutually reinforcing objectives. Preventing a sudden and severe contraction in fiscal policy will support the transition back to full employment, which should aid long-term fiscal sustainability. At the same time, a credible fiscal plan to put the federal budget on a longer-run sustainable path could help keep longer-term interest rates low and improve household and business confidence, thereby supporting improved economic performance today."
Earlier on Existing Home Sales:
• Existing Home Sales in October: 4.79 million SAAR, 5.4 months of supply
• Existing Home Sales: A Solid Report
• Existing Home Sales: The Increase in Conventional Sales
• Existing Home Sales graphs
Another question for the November economic prediction contest (Note: You can now use Facebook, Twitter, or OpenID to log in).
Existing Home Sales: The Increase in Conventional Sales
by Calculated Risk on 11/19/2012 06:40:00 PM
Earlier I pointed out that one the keys for housing to return to "normal" are more conventional sales and fewer distressed sales. Not all areas report the percentage of distressed sales, and the NAR uses an unscientific survey to estimate distressed sales.
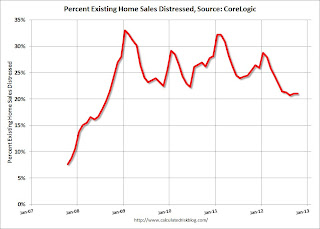
CoreLogic estimates the percent of distressed sales each month, and they were kind enough to send me their series. The first graph below shows CoreLogic's estimate of the distressed share starting in October 2007.
 Click on graph for larger image.
Note that the percent distressed increases every winter. This is because distressed sales happen all year, and conventional sales follow the normal seasonal pattern of stronger in the spring and summer, and weaker in the winter.
This is why the Case-Shiller seasonal adjustment increased in recent years.
Also note that the percent of distressed sales over the last 5 months is at the lowest level since mid-2008, but still very high.
The second graph shows the NAR existing home series using the CoreLogic share of distressed sales.
 If we just look at conventional sales (blue), sales declined from over 7 million in 2005 (graph starts in 2007) to a low of under 2.5 million.
Using this method (NAR estimate for sales, CoreLogic estimate of share), conventional sales are now back up to around 3.8 million SAAR. The NAR reported total sales were up 10.9% year-over-year in October, but using this method, conventional sales were up almost 18% year-over-year.
Earlier:
• Existing Home Sales in October: 4.79 million SAAR, 5.4 months of supply
• Existing Home Sales: A Solid Report
• Existing Home Sales graphs
Early: Housing Forecasts for 2013
by Calculated Risk on 11/19/2012 04:49:00 PM
Towards the end of each year I start to collect some housing forecasts for the following year. Here was a summary of forecasts for 2012. Right now it looks like new home sales will be around 365 thousand this year, and total starts around 750 thousand or so.
From Hui Shan, Sven Jari Stehn, Jan Hatzius at Goldman Sachs:
We project housing starts to continue to rise, reaching an annual rate of 1.0 million by the end of 2013 and 1.5 million by the end of 2016.Fannie Mae Chief Economist Doug Duncan is forecasting an 18.4% increase in housing starts in 2013 to 888 thousand, and single family starts increasing to 611 thousand.
Duncan projects new single family home sales to increase to 433 thousand from around 368 thousand this year. Duncan projects existing home sales will increase slightly to 4.76 million next year.
I'll be adding more forecasts, but I think we will see another solid percentage increase for housing starts and new home sales next year.
Existing Home Sales: A Solid Report
by Calculated Risk on 11/19/2012 12:35:00 PM
First, this report is a reminder that we have to be careful with the NAR data. The NAR revised down inventory for September from 2.32 million to 2.17 million (a downward revision of 6.5%). And the months-of-supply for September was revised down to 5.6 months from 5.9 months. These are very large revisions.
The percent distressed share (foreclosures and short sales) is also questionable. The NAR reported:
Distressed homes - foreclosures and short sales sold at deep discounts - accounted for 24 percent of October sales (12 percent were foreclosures and 12 percent were short sales), unchanged from September; they were 28 percent in October 2011.However this percentage is from an unscientific survey of Realtors, and other data suggests a larger decline in the share of distressed sales.
Oh well, I wish we had better data for the existing home market.
However, overall, this was a solid report. Based on historical turnover rates, I think "normal" sales would be in the 4.5 to 5.0 million range. So, existing home sales at 4.79 million are in the normal range.
Of course a "normal" market would have very few distressed sales, so there is still a long ways to go, but the market is headed in the right direction. The key to returning to "normal" are more conventional sales and fewer distressed sales. Not all areas report the percentage of distressed sales - that is why the NAR uses an unscientific survey - but the areas that do have shown a sharp decline in distressed sales, and a sharp increase in conventional sales.
Of course what matters the most in the NAR's existing home sales report is inventory. It is active inventory that impacts prices (although the "shadow" inventory will keep prices from rising). For existing home sales, look at inventory first and then at the percent of conventional sales.
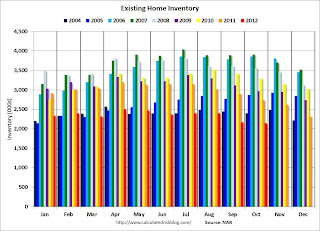
The NAR reported inventory decreased to 2.14 million units in October, down from 2.17 million in September. This is down 21.9% from October 2011, and down 25% from the inventory level in October 2005 (mid-2005 was when inventory started increasing sharply). This is the lowest level for the month of October since 2001.
Important: The NAR reports active listings, and although there is some variability across the country in what is considered active, most "contingent short sales" are not included. "Contingent short sales" are strange listings since the listings were frequently NEVER on the market (they were listed as contingent), and they hang around for a long time - they are probably more closely related to shadow inventory than active inventory. However when we compare inventory to 2005, we need to remember there were no "short sale contingent" listings in 2005. In the areas I track, the number of "short sale contingent" listings is also down sharply year-over-year.
 Click on graph for larger image.
This graph shows inventory by month since 2004. In 2005 (dark blue columns), inventory kept rising all year - and that was a clear sign that the housing bubble was ending.
This year (dark red for 2012) inventory is at the lowest level for the month of October since 2001, and inventory is below the level in October 2005 (not counting contingent sales). Earlier this year I argued months-of-supply would be below 6 towards the end of the year, and months-of-supply fell to 5.4 months in October (a normal range).
The following graph shows existing home sales Not Seasonally Adjusted (NSA).
 Sales NSA in October (red column) are sharply above last year (there were 2 more selling days this year in October). Sales are well below the bubble years of 2005 and 2006.
Earlier:
• Existing Home Sales in October: 4.79 million SAAR, 5.4 months of supply
• Existing Home Sales graphs
NAHB Builder Confidence increases in November, Highest since May 2006
by Calculated Risk on 11/19/2012 11:12:00 AM
I'll have some more comments on the Existing Home Sales report later this morning, but this is important too ...
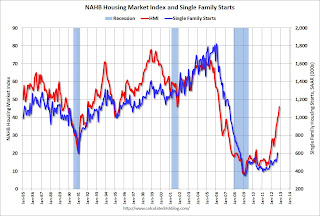
The National Association of Home Builders (NAHB) reported the housing market index (HMI) increased 5 points in November to 46. Any number under 50 indicates that more builders view sales conditions as poor than good.
From the NAHB: Builder Confidence Rises Five Points in November
Builder confidence in the market for newly built, single-family homes posted a solid, five-point gain to 46 on the National Association of Home Builders/Wells Fargo Housing Market Index (HMI) for November, released today. This marks the seventh consecutive monthly gain in the confidence gauge and brings it to its highest point since May of 2006.
“While our confidence gauge has yet to breach the 50 mark -- at which point an equal number of builders view sales conditions as good versus poor -- we have certainly made substantial progress since this time last year, when the HMI stood at 19,” observed NAHB Chief Economist David Crowe. “At this point, difficult appraisals and tight lending conditions for builders and buyers remain limiting factors for the burgeoning housing recovery, along with shortages of buildable lots that have begun popping up in certain markets.”
...
Two out of three of the HMI’s component indexes registered gains in November. The component gauging current sales conditions posted the biggest increase, with an eight-point gain to 49 – its highest mark in more than six years. Meanwhile, the component measuring sales expectations for the next six months held above 50 for a third consecutive month with a two-point gain to 53, and the component measuring traffic of prospective buyers held unchanged at 35 following a five-point gain in the previous month.
All four regions of the country posted gains in their HMI three-month moving averages as of November. The South posted a four-point gain to 43, while the Midwest and West each posted three-point gains, to 45 and 47, respectively, and the Northeast posted a two-point gain to 31. (Note, the HMI survey was conducted in the two weeks immediately following Hurricane Sandy and therefore does reflect builder sentiment during that period.)
 Click on graph for larger image.
This graph compares the NAHB HMI (left scale) with single family housing starts (right scale). This includes the November release for the HMI and the September data for starts (October housing starts will be released tomorrow). This was above the consensus estimate of a reading of 41.


