by Calculated Risk on 10/27/2012 01:11:00 PM
Saturday, October 27, 2012
Unofficial Problem Bank list declines to 864 Institutions
This is an unofficial list of Problem Banks compiled only from public sources.
Here is the unofficial problem bank list for Oct 26, 2012. (table is sortable by assets, state, etc.)
Changes and comments from surferdude808:
The FDIC released its actions through September 2012 and closed a bank this week. There were five removals and four additions leaving the Unofficial Problem Bank List with 864 institutions with assets of $330.4 billion. A year ago, the list had 985 institutions with assets of $406.6 billion. For the month, changes included 11 action terminations, four failures, one unassisted merger, and six additions. Overall, it was a quiet month as it was the fewest action terminations since February 2012 and the fewest additions since the publication of the list.CR Note: The FDIC's official problem bank list is comprised of banks with a CAMELS rating of 4 or 5, and the list is not made public. (CAMELS is the FDIC rating system, and stands for Capital adequacy, Asset quality, Management, Earnings, Liquidity and Sensitivity to market risk. The scale is from 1 to 5, with 1 being the strongest.)
Actions were terminated against Metro Bank, Lemoyne, PA ($2.4 billion Ticker: METR); Heritage Bank of Central Illinois, Trivoli, IL ($308 million); Minnwest Bank South, Tracy, MN ($213 million); and Freedom Bank, Sterling, IL ($76 million). The failure was Nova Bank, Berwyn, PA ($483 million), which the FDIC could not find a buyer for.
The additions were First State Financial, Inc., Pineville, KY ($395 million); Golden Eagle Community Bank, Woodstock, IL ($152 million); Signature Bank of Georgia, Sandy Springs, GA ($136 million); and Talbot State Bank, Woodland, GA ($72 million). Who would have guessed there are still some unidentified problem banks in Georgia.
As a substitute for the CAMELS ratings, surferdude808 is using publicly announced formal enforcement actions, and also media reports and company announcements that suggest to us an enforcement action is likely, to compile a list of possible problem banks in the public interest.
When the list was increasing, the official and "unofficial" counts were about the same. Now, with the number of problem banks declining, the unofficial list is lagging the official list. This probably means regulators are changing the CAMELS rating on some banks before terminating the formal enforcement actions.
Earlier:
• Summary for Week Ending Oct 26th
Summary for Week Ending Oct 26th
by Calculated Risk on 10/27/2012 08:09:00 AM
There was some disappointing data last week - mostly from some regional manufacturing surveys, but also mortgage delinquencies increased - but overall this was the fourth week in a row with somewhat better than expected data, and this suggests a little pickup in economic activity.
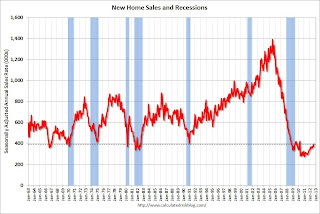
Once again housing beat expectations. New home sales increased to 389,000, a pace well above the 306,000 sales in 2011, and the highest level since the tax credit related spike in April 2010. Q3 GDP was weak, but slightly above expectations - and residential investment was a fairly strong contributor to growth.
The Architecture Billings Index is now showing expansion (an indicator for commercial real estate including apartments). And the trucking index increased in September (although this index has been moving sideways this year).
On the downside, the Richmond and Kansas City Fed manufacturing surveys were weak and indicated contraction in October. The recent trend is continuing: housing is improving, but manufacturing is struggling.
Here is a summary of last week in graphs:
• New Home Sales at 389,000 SAAR in September
 Click on graph for larger image in graph gallery.
The Census Bureau reported New Home Sales in September were at a seasonally adjusted annual rate (SAAR) of 389 thousand. This was up from a revised 368 thousand SAAR in August (revised down from 373 thousand). This is the highest level since April 2010 (tax credit related bounce).
The first graph shows New Home Sales vs. recessions since 1963. The dashed line is the current sales rate.
Starting in 1973 the Census Bureau broke inventory down into three categories: Not Started, Under Construction, and Completed.
 This graph shows the three categories of inventory starting in 1973.
The inventory of completed homes for sale was at a record low 38,000 units in September. The combined total of completed and under construction is just above the record low since "under construction" is starting to increase.
Even though sales are still very low, new home sales have clearly bottomed. New home sales have averaged 364 thousand SAAR over the first 9 months of 2012, after averaging under 300 thousand for the previous 18 months. Sales are finally above the lows for previous recessions too.
This was slightly above expectations of 385,000, and was another fairly solid report. This indicates an ongoing recovery in residential investment.
• Real GDP increased 2.0% annual rate in Q3
 This graph shows the quarterly real GDP growth (at an annual rate) for the last 30 years.
The Red column (and dashed line) is the advance estimate for Q3 GDP.
The Q3 GDP report was weak, with 2.0% annualized real GDP growth, but slightly better than expected. Final demand increased in Q3 as personal consumption expenditures increased at a 2.0% annual rate (up from 1.5% in Q2), and residential investment increased at a 14.4% annual rate (up from 8.5% in Q2).
Investment in equipment and software was flat in Q3, and investment in non-residential structures was negative. However, it appears the drag from state and local governments will end soon (after declining for 3 years).
The next graph shows the contribution to percent change in GDP for residential investment and state and local governments since 2005.
 The blue bars are for residential investment (RI), and RI was a significant drag on GDP for several years. Now RI has added to GDP growth for the last 6 quarters (through Q3 2012).
However the drag from state and local governments is ongoing, although the drag in Q3 was very small. State and local governments have been a drag on GDP for twelve consecutive quarters. Although not as large a negative as the worst of the housing bust (and much smaller spillover effects), this decline has been relentless and unprecedented. The good news is the drag appears to be ending.
In real terms, state and local government spending is now back to 2001 levels, even with a larger population.
 Residential Investment as a percent of GDP is up from the record lows during the housing bust. Usually RI bounces back quickly following a recession, but this time there is a wide bottom because of the excess supply of existing vacant housing units.
 Last year the increase in RI was mostly from multifamily and home improvement investment. Now the increase is from most categories including single family. I'll break down Residential Investment (RI) into components after the GDP details are released this coming week. Note: Residential investment (RI) includes new single family structures, multifamily structures, home improvement, broker's commissions, and a few minor categories.
The key story is that residential investment is continuing to increase, and I expect this to continue (although the recovery in RI will be sluggish compared to previous recoveries). Since RI is the best leading indicator for the economy, this suggests no recession this year or in 2013 (with the usual caveats about Europe and policy errors in the US).
• AIA: Architecture Billings Index increased in September
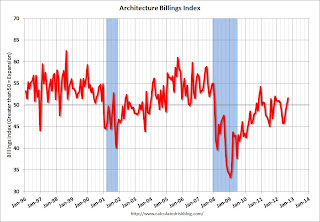 This graph shows the Architecture Billings Index since 1996. The index was at 51.6 in September, up from 50.2 in August. Anything above 50 indicates expansion in demand for architects' services.
This increase is mostly being driven by demand for design of multi-family residential buildings - and this suggests there are more apartments coming (there are already quite a few apartments under construction). Note: This includes commercial and industrial facilities like hotels and office buildings, multi-family residential, as well as schools, hospitals and other institutions.
According to the AIA, there is an "approximate nine to twelve month lag time between architecture billings and construction spending" on non-residential construction. This suggests increase in CRE investment next year (it will be some time before investment in offices and malls increases).
• ATA Trucking Index increased in September
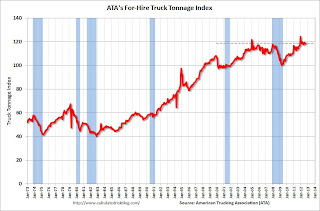 From ATA: ATA Truck Tonnage Index Rose 0.4% in September
Note: ATA Chief Economist Bob Costello says, for trucking, the pickup in housing is offsetting the "flattening in manufacturing output".
Here is a long term graph that shows ATA's For-Hire Truck Tonnage index.
The dashed line is the current level of the index. The index is above the pre-recession level and up 2.4% year-over-year - but has been mostly moving sideways in 2012.
• Final October Consumer Sentiment at 82.6
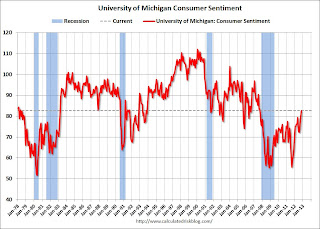 The final Reuters / University of Michigan consumer sentiment index for October declined to 82.6 from the preliminary reading of 83.1, and was up from the September reading of 78.3.
This was slightly below the consensus forecast of 83.1. Overall sentiment is still weak - probably due to a combination of the high unemployment rate and the sluggish economy - but consumer sentiment has been improving.
Friday, October 26, 2012
Report: Bailout Costs for Fannie and Freddie expected to decline
by Calculated Risk on 10/26/2012 10:50:00 PM
From Nick Timiraos at the WSJ: Cost of Bailing Out Fannie and Freddie Expected to Fall Sharply
Fannie Mae and Freddie Mac are expected to begin repaying taxpayers for their bailout faster than initially projected, in part because of an improving housing market.Here is the report from the FHFA: FHFA Updates Projections of Potential Draws for Fannie Mae and Freddie Mac.
The Federal Housing Finance Agency, the companies' federal regulator, released a report on Friday that estimated they will pay between $32 billion and $78 billion to the U.S. Treasury through 2015. The baseline forecast assumes that the companies would end up costing taxpayers $76 billion by the end of 2015, down from the current tab of $142 billion.
...
The regulator's latest forecasts show that Freddie Mac won't require additional government support, even under a "worst case" scenario that envisions further home-price declines. Fannie might need government aid this year to pay the 10% dividend but would only need additional aid in subsequent years if home prices were to fall sharply.
Bank Failure #47: NOVA Bank, Berwyn, Pennsylvania
by Calculated Risk on 10/26/2012 06:08:00 PM
Ahora supernova
Abandonado
by Soylent Green is People
From the FDIC: FDIC Approves the Payout of the Insured Deposits of NOVA Bank, Berwyn, Pennsylvania
The FDIC was unable to find another financial institution to take over the banking operations of NOVA Bank. The FDIC will mail checks directly to depositors of NOVA Bank for the amount of their insured money.No one wanted this one.
...
As of June 30, 2012, NOVA Bank had approximately $483.0 million in total assets and $432.2 million in total deposits. ... The FDIC estimates that the cost to the Deposit Insurance Fund (DIF) will be $91.2 million. NOVA Bank is the 47th FDIC-insured institution to fail in the nation this year, and the second in Pennsylvania.
Zillow forecasts Case-Shiller House Price index to show 1.7% Year-over-year increase for August
by Calculated Risk on 10/26/2012 03:32:00 PM
Note: The Case-Shiller report to be released next Tuesday is for August (really an average of prices in June, July and August).
Zillow Forecast: August Case-Shiller Composite-20 Expected to Show 1.7% Increase from One Year Ago
On Tuesday Oct. 30, the Case-Shiller Composite Home Price Indices for August will be released. Zillow predicts that the 20-City Composite Home Price Index (non-seasonally adjusted [NSA]) will be up by 1.7 percent on a year-over-year basis, while the 10-City Composite Home Price Index (NSA) will be up 1.2 percent on a year-over-year basis. The seasonally adjusted (SA) month-over-month change from July to August will be 0.2 percent for the 20-City Composite and 0.3 percent for the 10-City Composite Home Price Index (SA). All forecasts are shown in the table below and are based on a model incorporating the previous data points of the Case-Shiller series, the August Zillow Home Value Index data and national foreclosure re-sales.Zillow's forecasts for Case-Shiller have been pretty close.
As the housing market recovery continues, home prices are expected to modestly appreciate, with growth rates being below “normal” pre-housing recession levels. Zillow’s Home Value Index for September was released on Monday night and shows the largest quarterly appreciation since March 2006, showing that the market is regaining some of its strength. National home values are up 3.2 percent from year-ago levels and have now seen four consecutive quarters of appreciation. While the national housing market is showing consistent signs of improvement, the recovery is uneven across the country. Some markets, such as Phoenix, Riverside and Miami are doing exceptionally well, while St. Louis and Atlanta are still faltering. Part of the strong home value appreciation we are seeing is driven by acute inventory shortages in many markets with foreclosures and foreclosure re-sales down and many people still locked up in negative equity, limiting overall supply. In these last months of 2012, Case-Shiller indices are expected to moderate and likely report monthly declines toward the end of the year tracking the Zillow Home Value Index. Monthly depreciation toward the end of the year is largely a function of declining overall monthly sales volume, which will increase the percentage of foreclosure re-sales in the transactional mix being tracked by Case-Shiller.
| Case Shiller Composite 10 | Case Shiller Composite 20 | ||||
|---|---|---|---|---|---|
| NSA | SA | NSA | SA | ||
| Case Shiller (year ago) | August 2011 | 156.51 | 153.49 | 142.97 | 140.11 |
| Case-Shiller (last month) | July 2012 | 157.3 | 154.85 | 144.61 | 142.1 |
| Zillow June Forecast | YoY | 1.2% | 1.2% | 1.7% | 1.7% |
| MoM | 0.7% | 0.3% | 0.5% | 0.2% | |
| Zillow Forecasts1 | 158.4 | 155.3 | 145.4 | 142.4 | |
| Current Post Bubble Low | 146.52 | 149.19 | 134.10 | 136.45 | |
| Date of Post Bubble Low | Mar-12 | Jan-12 | Mar-12 | Jan-12 | |
| Above Post Bubble Low | 8.1% | 4.1% | 8.4% | 4.4% | |
| 1Estimate based on Year-over-year and Month-over-month Zillow forecasts | |||||
LPS: House Price Index increased 0.2% in August
by Calculated Risk on 10/26/2012 02:20:00 PM
Notes: I follow several house price indexes (Case-Shiller, CoreLogic, LPS, Zillow, FNC and more). The timing of different house prices indexes can be a little confusing. LPS uses August closings only (not a three month average like Case-Shiller or a weighted average like CoreLogic), excludes short sales and REOs, and is not seasonally adjusted.
From LPS: U.S. Home Prices Up 0.2 Percent for the Month; Up 2.6 Percent Year-Over-Year
Lender Processing Services ... today released its latest LPS Home Price Index (HPI) report, based on August 2012 residential real estate transactions. The LPS HPI combines the company’s extensive property and loan-level databases to produce a repeat sales analysis of home prices as of their transaction dates every month for each of more than 15,500 U.S. ZIP codes. The LPS HPI represents the price of non-distressed sales by taking into account price discounts for REO and short sales.The LPS HPI is off 23.0% from the peak in June 2006.
In May, the LPS HPI was up 0.4% year-over-year, in June, the index was up 0.9% year-over-year, and 1.8% in July, and now 2.6% in August. This is steady improvement on a year-over-year basis. Note: Case-Shiller for August will be released this coming Tuesday.
Comments on Q3 GDP and Investment
by Calculated Risk on 10/26/2012 12:15:00 PM
The Q3 GDP report was weak, with 2.0% annualized real GDP growth, but slightly better than expected. Final demand increased in Q3 as personal consumption expenditures increased at a 2.0% annual rate (up from 1.5% in Q2), and residential investment increased at a 14.4% annual rate (up from 8.5% in Q2).
Investment in equipment and software was flat in Q3, and investment in non-residential structures was negative. However, it appears the drag from state and local governments will end soon (after declining for 3 years).
Overall this was another weak report indicating sluggish growth.
The following graph shows the contribution to GDP from residential investment, equipment and software, and nonresidential structures (3 quarter centered average). This is important to follow because residential investment tends to lead the economy, equipment and software is generally coincident, and nonresidential structure investment trails the economy.
For the following graph, red is residential, green is equipment and software, and blue is investment in non-residential structures. So the usual pattern - both into and out of recessions is - red, green, blue.
The dashed gray line is the contribution from the change in private inventories.
 Click on graph for larger image.
Residential Investment (RI) made a positive contribution to GDP in Q3 for the sixth consecutive quarter. Usually residential investment leads the economy, but that didn't happen this time because of the huge overhang of existing inventory, but now RI is contributing. The good news: Residential investment has clearly bottomed.
The contribution from RI will probably continue to be sluggish compared to previous recoveries, but the ongoing positive contribution to GDP is a significant story.
Equipment and software investment was unchanged in Q3 (compared to Q2). This followed twelve consecutive quarters with a positive contribution.
The contribution from nonresidential investment in structures was negative in Q3. Nonresidential investment in structures typically lags the recovery, however investment in energy and power has masked the ongoing weakness in office, mall and hotel investment (the underlying details will be released next week).
The second graph shows the contribution to percent change in GDP for residential investment and state and local governments since 2005.
 The blue bars are for residential investment (RI), and RI was a significant drag on GDP for several years. Now RI has added to GDP growth for the last 6 quarters (through Q3 2012).
However the drag from state and local governments is ongoing, although the drag in Q3 was very small. State and local governments have been a drag on GDP for twelve consecutive quarters. Although not as large a negative as the worst of the housing bust (and much smaller spillover effects), this decline has been relentless and unprecedented. The good news is the drag appears to be ending.
In real terms, state and local government spending is now back to 2001 levels, even with a larger population.
 Residential Investment as a percent of GDP is up from the record lows during the housing bust. Usually RI bounces back quickly following a recession, but this time there is a wide bottom because of the excess supply of existing vacant housing units.
Last year the increase in RI was mostly from multifamily and home improvement investment. Now the increase is from most categories including single family. I'll break down Residential Investment (RI) into components after the GDP details are released this coming week. Note: Residential investment (RI) includes new single family structures, multifamily structures, home improvement, broker's commissions, and a few minor categories.
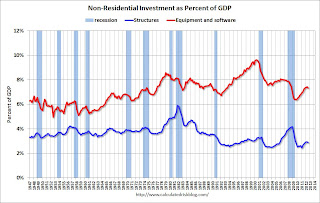 The last graph shows non-residential investment in structures and equipment and software.
I'll add details for investment in offices, malls and hotels next week.
The key story is that residential investment is continuing to increase, and I expect this to continue (although the recovery in RI will be sluggish compared to previous recoveries). Since RI is the best leading indicator for the economy, this suggests no recession this year or in 2013 (with the usual caveats about Europe and policy errors in the US).
Earlier with revision graphs:
• Real GDP increased 2.0% annual rate in Q3
Final October Consumer Sentiment at 82.6
by Calculated Risk on 10/26/2012 09:55:00 AM
Note: I'll have much more on GDP soon.

Click on graph for larger image.
The final Reuters / University of Michigan consumer sentiment index for October declined to 82.6 from the preliminary reading of 83.1, and was up from the September reading of 78.3.
This was slightly below the consensus forecast of 83.1. Overall sentiment is still weak - probably due to a combination of the high unemployment rate and the sluggish economy - but consumer sentiment has been improving.
Real GDP increased 2.0% annual rate in Q3
by Calculated Risk on 10/26/2012 08:38:00 AM
Real gross domestic product -- the output of goods and services produced by labor and property located in the United States -- increased at an annual rate of 2.0 percent in the third quarter of 2012 (that is, from the second quarter to the third quarter), according to the "advance" estimate released by the Bureau of Economic Analysis. In the second quarter, real GDP increased 1.3 percent.
The increase in real GDP in the third quarter primarily reflected positive contributions from personal consumption expenditures (PCE), federal government spending, and residential fixed investment that were partly offset by negative contributions from exports, nonresidential fixed investment, and private inventory investment. Imports, which are a subtraction in the calculation of GDP, decreased.
The acceleration in real GDP in the third quarter primarily reflected an upturn in federal government spending, a downturn in imports, an acceleration in PCE, a smaller decrease in private inventory investment, an acceleration in residential fixed investment, and a smaller decrease in state and local government spending that were partly offset by downturns in exports and in nonresidential fixed investment.
 Click on graph for larger image.
This graph shows the quarterly real GDP growth (at an annual rate) for the last 30 years.
The Red column (and dashed line) is the advance estimate for Q3 GDP.
A few comments:
• Consumer spending picked up a little. Real personal consumption expenditures increased 2.0 percent in the third quarter, compared with an increase of 1.5 percent in the second.
• Residential investment increased. Real residential fixed investment increased 14.4 percent, compared with an increase of 8.5 percent.
• State and local government made a negative contribution to GDP for the twelfth straight quarter, but the negative contribution was very minor.
This was slightly above expectations. I'll have more on GDP later ...
Thursday, October 25, 2012
Friday: Q3 GDP
by Calculated Risk on 10/25/2012 09:06:00 PM
Expectations for Q3 GDP are pretty low ... and moving lower. From the WSJ: GDP Estimates Move Lower Following Durables Report
The consensus estimate of economists surveyed by Dow Jones Newswires is that Friday’s report will show the economy grew at a seasonally adjusted annual rate of 1.8% in the July-to-September quarter. But after Thursday’s figures on business investment, some economists said they are bracing for a weaker GDP report than the consensus figure.Friday:
Wells Fargo — pointing out that shipments of core capital goods fell at an annual pace of 4.9% over three months — lowered its estimate of third-quarter GDP growth to an annual rate of 1.4% from 1.6%. J.P. Morgan Chase lowered its forecast to 1.6% from 1.8%.
“The downside risks are mounting to our already below-consensus estimate that GDP increased by only 1.3% in the third quarter,” Paul Ashworth, chief U.S. economist at London-based Capital Economics, said in a note to clients. “At 1.8%, the consensus forecast looks way to high.”
• At 8:30 AM ET, the advance release for Q3 GDP will be released by the BEA. The consensus is that real GDP increased 1.9% annualized in Q3.
• At 9:55 AM, the Reuters/University of Michigan's Consumer sentiment index (final for October). The consensus is for no change from the preliminary reading of 83.1.
Another question for the October economic prediction contest (Note: You can now use Facebook, Twitter, or OpenID to log in).


