by Calculated Risk on 8/29/2012 11:00:00 AM
Wednesday, August 29, 2012
Fed: Consumer Deleveraging Continued in Q2
From the NY Fed: Overall Delinquency Rates Down as Americans Paying More Debt on Time
In its latest Quarterly Report on Household Debt and Credit, the Federal Reserve Bank of New York today announced that delinquency rates for mortgages (6.3 percent), credit cards (10.9 percent), and auto loans (4.2 percent) decreased from the previous quarter. However, rates for student loans (8.9 percent) and home equity lines of credit (HELOC) (4.9 percent) increased from March.Here is the Q2 report: Quarterly Report on Household Debt and Credit
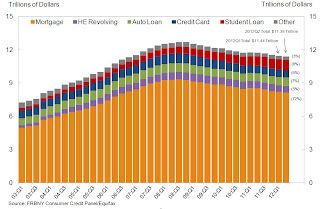
Household indebtedness declined to $11.38 trillion, a $53 billion decline from the first quarter of 2012. Outstanding household debt has decreased $1.3 trillion since its peak in Q3 2008. The reduction was led by a decline in real estate-related debt like mortgages and HELOC. More information about how Americans are paying down their debt is available in our corresponding blog post.
"The continuing decrease in delinquency rates suggests that consumers are managing their debts better," said Wilbert van Der Klaauw, vice president and economist at the New York Fed. "As they continue to pay down debt and take advantage of low interest rates, Americans are moving forward with rebalancing their household finances."
... Mortgage originations, which we measure as the appearance of new mortgages on consumer credit reports, rose to $463 billion.
Mortgage balances shown on consumer credit reports continued to fall, and now stand at $8.15 trillion, a 0.5% decrease from the level in 2012Q1. Home equity lines of credit (HELOC) balances dropped by $23 billion (3.7%). Household debt balances excluding mortgages and HELOCS increased by 0.4% in the second quarter to $2.6 trillion, boosted by increases of $14 billion in auto loans and $10 billion in student loans.Here are two graphs:
...
About 256,000 individuals had a new foreclosure notation added to their credit reports between March 31 and June 30, a slowdown of 12% since the first quarter and the lowest number seen since mid-2007. ... Foreclosures are down 55% from its peak in Q2 of 2009, which coincided with the bottom of the recession.
 Click on graph for larger image.
The first graph shows aggregate consumer debt decreased in Q2. This was mostly due to a decline in mortgage debt.
However student debt is still increasing. From the NY Fed:
Student loan debt rose $10 billion to $914 billion. ... Since the peak in household debt in 2008Q3, student loan debt has increased by $303 billion, while other forms of debt fell a combined $1.6 trillion.
 The second graph shows the percent of debt in delinquency. In general, the percent of delinquent debt is declining, but what really stands out is the percent of debt 90+ days delinquent (Yellow, orange and red).
 From the NY Fed:
Overall delinquencies improved in 2012Q2. As of June 30, 9.0% of outstanding debt was in some stage of delinquency, compared with 9.3% at the end of 2012Q1. About $1.02 trillion of debt is delinquent, with $765 billion seriously delinquent (at least 90 days late or “severely derogatory”).There are a number of credit graphs at the NY Fed site.
NAR: Pending home sales index increased 2.4% in July
by Calculated Risk on 8/29/2012 10:05:00 AM
From the NAR: July Pending Home Sales Rebound
The Pending Home Sales Index, a forward-looking indicator based on contract signings, rose 2.4 percent to 101.7 in July from 99.3 in June and is 12.4 percent above July 2011 when it was 90.5. The data reflect contracts but not closings.This was above the consensus forecast of a 1.0% increase for this index and is the highest level in two years (since the expiration of the housing tax credit).
The PHSI in the Northeast increased 0.5 percent to 77.0 in July and is 13.4 percent higher than a year ago. In the Midwest the index grew 3.4 percent to 97.4 in July and is 20.2 percent above July 2011. Pending home sales in the South rose 5.2 percent to an index of 111.7 in July and are 15.6 percent above a year ago. In the West the index slipped 1.7 percent in July to 109.9 but is 1.3 percent higher than July 2011.
Contract signings usually lead sales by about 45 to 60 days, so this is for sales in August and September.
Q2 GDP Growth Revised up to 1.7% Annualized
by Calculated Risk on 8/29/2012 08:47:00 AM
Real gross domestic product -- the output of goods and services produced by labor and property located in the United States -- increased at an annual rate of 1.7 percent in the second quarter of 2012 (that is, from the first quarter to the second quarter), according to the "second" estimate released by the Bureau of Economic Analysis.The main revisions were:
PCE was revised up from 1.5% to 1.7% (services were revised up).
Investment was revised down (the contribution to GDP from Change in private inventories was revised from +0.32 percentage points to -0.23 in the second release).
Imports are revised down. PCE prices increased at only 0.7% annualized (same as advance release), and core PCE prices increased at a 1.7% annual rate. Overall these changes are minor and were at expectations. This is still sluggish growth.
MBA: Mortgage Refinance Activity declines
by Calculated Risk on 8/29/2012 07:03:00 AM
From the MBA: Mortgage Applications Decrease in Latest MBA Weekly Survey
The Refinance Index decreased 6 percent from the previous week to its lowest level since May 11, 2012. The seasonally adjusted Purchase Index increased more than 1 percent from one week earlier.
The average contract interest rate for 30-year fixed-rate mortgages with conforming loan balances ($417,500 or less) decreased to 3.80 percent from 3.86 percent, with points remaining unchanged at 0.42 (including the origination fee) for 80 percent loan-to-value ratio (LTV) loans.
 Click on graph for larger image.
This graph shows the MBA mortgage purchase index.
The purchase index has been mostly moving sideways over the last two years.
I'm still puzzling over why the MBA index is moving sideways but the recent Senior Loan Officer survey showed "moderately to stronger" demand for mortgages to purchase homes:

Over half the banks surveyed reported moderately to substantially strong demand for mortgage to purchase homes. It isn't clear why the MBA index and the Fed survey results are different.
Tuesday, August 28, 2012
Wednesday: Q2 GDP update, Pending Home Sales, Beige Book
by Calculated Risk on 8/28/2012 08:37:00 PM
First an excerpt from a research note by Jan Hatzius at Goldman Sachs:
At a minimum, we expect an extension of the forward rate guidance to "mid-2015" at the September 12-13 FOMC meeting. We also expect an eventual return to QE, although in terms of timing we believe that either December or early 2013 is still more likely than September.On Wednesday:
...
The tone of the data has clearly improved a bit since the [last FOMC] meeting. ... we estimate that Q3 GDP is on track for a 2.4% annualized gain versus an advance estimate of 1.5% for Q2.
However, a return to QE in September is clearly possible if the upcoming data, especially the August employment report released on September 7, fall short of expectations or if financial conditions tighten again--e.g., in the wake of any disappointment around the European situation and the ECB meeting on September 6.
• At 7:00 AM ET, the Mortgage Bankers Association (MBA) will release the mortgage purchase applications index.
• At 8:30 AM, the BEA will release the 2nd estimate of Q2 GDP. The consensus is that real GDP increased 1.7% annualized in Q2, revised up from 1.5% in the advance release.
• At 10:00 AM, the Pending Home Sales Index for August will be released. The consensus is for a 1.0% increase in the index.
• At 11:00 AM, the New York Fed will release the Q2 2012 Report on Household Debt and Credit
• 2:00 PM, the Federal Reserve Beige Book will be released. This is an informal review by the Federal Reserve Banks of current economic conditions in their Districts.
A question for the August economic prediction contest (Note: You can now use Facebook, Twitter, or OpenID to log in).
Housing: Two Bearish Views on House Prices and Foreclosures
by Calculated Risk on 8/28/2012 05:04:00 PM
First a couple of bearish views on house prices - clearly residential investment has bottomed, but some analysts think house prices will fall further.
• From RadarLogic: Apparent Strength in Home Price Metrics Driven by Decline in Distressed Sales
A decline in sales of homes in bank inventories, coupled with an increase in the rate of all other sales, helped drive the 25 metropolitan area RPX Composite price to a year-over-year gain in June, according to the June 2012 RPX Monthly Housing Market Report ...• From Mark Hanson posted at the Big Picture: Hanson On Case Shiller
"The absence of real price appreciation when distressed sales are excluded from the analysis suggests that traditional home buyers remain hesitant to return to the market in strength," said Michael Feder, Radar Logic's CEO. "We continue to be concerned that this negative psychology could be the biggest risk threatening any real recovery in housing values. If it continues, the resultant imbalance between supply and demand could trigger another decline in home values."
The gains of the first half of 2012 could be short lived. They were the result of seasonal factors and REO disposition strategies that could reverse in the fall. The unusually rapid price appreciation could give way to equally rapid declines in the second half of the year.
[T]oday’s CS is disappointing…a YoY 15% increase in purchasing power and 25% decrease in foreclosure resales and still the CS-20 NSA only managed a 0.5% gain over last year. To me, normalized, that means real house prices are still falling.My view is house prices probably bottomed early this year (back when I wrote "The Bottom is Here").
And on foreclosures: CoreLogic® Reports 58,000 Completed Foreclosures in July
According to the report, there were 58,000 completed foreclosures in the U.S. in July 2012 down from 69,000 in July 2011 and 62,000* in June 2012. Since the financial crisis began in September 2008, there have been approximately 3.8 million completed foreclosures across the country. Completed foreclosures are an indication of the total number of homes actually lost to foreclosure.Earlier:
...
“Completed foreclosures were down again in July, this time by 16 percent versus a year ago, as servicers increasingly rely on alternatives to the foreclosure process, such as short sales and modifications,” said Mark Fleming, chief economist for CoreLogic. “Completed foreclosures remain concentrated in five states, California, Florida, Michigan, Texas and Georgia, accounting for 48 percent of all completed foreclosures nationwide in July.”
• Case-Shiller: House Prices increased 0.5% year-over-year in June
• House Price Comments, Real House Prices, Price-to-Rent Ratio
• All Current House Price Graphs
FDIC reports Fewer Problem banks, REO Declines; Total REO Declines in Q2
by Calculated Risk on 8/28/2012 02:50:00 PM
The FDIC released the Quarterly Banking Profile for Q2 today.
Commercial banks and savings institutions insured by the Federal Deposit Insurance Corporation (FDIC) reported aggregate net income of $34.5 billion in the second quarter of 2012, a $5.9 billion improvement from the $28.5 billion in profits the industry reported in the second quarter of 2011. This is the 12th consecutive quarter that earnings have registered a year-over-year increase. Lower provisions for loan losses and higher gains on sales of loans and other assets accounted for most of the year-over-year improvement in earnings. Also noteworthy was an increase in loan balances for the fourth time in the last five quarters.The FDIC reported the number of problem banks declined:
The number of "problem" institutions fell for the fifth quarter in a row. The number of "problem" institutions declined from 772 to 732. This is the smallest number of "problem" banks since year-end 2009. Total assets of "problem" institutions declined from $292 billion to $282 billion. Fifteen insured institutions failed during the second quarter. This is the smallest number of failures in a quarter since the fourth quarter of 2008, when there were 12. Another nine banks have failed so far in the third quarter, bringing the total for the year to date to 40. At this point last year, there had been 68 failures.
 Click on graph for larger image.
And the dollar value of Real Estate Owned (REOs, foreclosure houses) declined from $11.1 billion in Q1 to $9.5 billion in Q2. This is the lowest level of REOs since Q1 2008.
This graph shows the dollar value of Residential REO for FDIC insured institutions. Note: The FDIC reports the dollar value and not the total number of REOs.
The next graph is from Tom Lawler and shows the total REO for Fannie, Freddie, FHA, Private Label (PLS) and FDIC insured institutions. This isn't all the REO, as Lawler noted before, it "excludes non-FHA government REO (VA, USDA, etc.), credit unions, finance companies, non-FDIC-insured banks and thrifts", but it is probably over 90%.
 Some comments from Tom Lawler:
On the SF REO front, the “carrying value” of 1-4 family REO properties of FDIC-insured institutions at the end of last quarter was $9.5302 billion, down from $11.0819 billion at the end of the first quarter and $12.0895 billion a year ago. The FDIC does not report (or even collect) data on the number of 1-4 family REO properties held by FDIC-insured institutions, which is annoying.
Assuming that the carrying value of SF REO properties held by FDIC-insured institutions is 50% higher than the average of Fannie and Freddie, here is a chart showing trends in the SF REO inventories of Fannie, Freddie, FHA, private-label securities (from Barclays Capital), and FDIC-insured institutions.
Combined REO inventories last quarter were down about 21% from a year ago, and were at the lowest level since 2007.
House Price Comments, Real House Prices, Price-to-Rent Ratio
by Calculated Risk on 8/28/2012 11:56:00 AM
Case-Shiller reported the first year-over-year (YoY) gain in their house price indexes since 2010 - and the increase back in 2010 was related to the housing tax credit. Excluding the tax credit, this is the first YoY increase since 2006. The YoY increase in June suggests that house prices probably bottomed earlier this year (the YoY change lags the turning point for prices).
Since there is a seasonal pattern for house prices, we should expect the month-over-month change to turn negative later this year (probably in the report for August or September). The key will be to watch the YoY change and also compare to the seasonal lows in March 2012. In June, the Case-Shiller Composite 20 index Not Seasonally Adjusted (NSA) was 6.0% above the March 2012 low.
No one should expect the strong price increases to continue. The Case-Shiller Composite 20 index NSA was up 2.3% in June from May. However a large portion of that increase was seasonal. On a Seasonally Adjusted (SA) basis, the Composite 20 index was up 0.9%. That is a 11% annualized rate - and that will not continue. I suspect much of the increase over the last few months was a "bounce off the bottom" and I don't expect prices to increase at this pace.
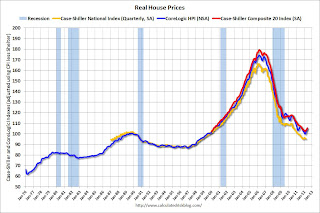
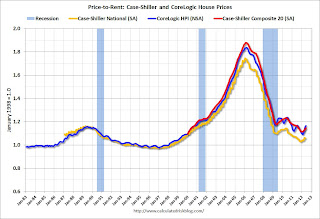
Here is another update to a few graphs: Case-Shiller, CoreLogic and others report nominal house prices, and it is also useful to look at house prices in real terms (adjusted for inflation) and as a price-to-rent ratio. Real prices, and the price-to-rent ratio, are back to late 1999 to 2000 levels depending on the index.
Nominal House Prices
 Click on graph for larger image.
The first graph shows the quarterly Case-Shiller National Index SA (through Q2 2012), and the monthly Case-Shiller Composite 20 SA and CoreLogic House Price Indexes (through June) in nominal terms as reported.
In nominal terms, the Case-Shiller National index (SA) is back to Q1 2003 levels (and also back up to Q4 2010), and the Case-Shiller Composite 20 Index (SA) is back to July 2003 levels, and the CoreLogic index (NSA) is back to November 2003.
Real House Prices
 The second graph shows the same three indexes in real terms (adjusted for inflation using CPI less Shelter). Note: some people use other inflation measures to adjust for real prices.
In real terms, the National index is back to mid-1999 levels, the Composite 20 index is back to June 2000, and the CoreLogic index back to October 2000.
As we've discussed before, in real terms, all of the appreciation early in the last decade is still gone.
Price-to-Rent
In October 2004, Fed economist John Krainer and researcher Chishen Wei wrote a Fed letter on price to rent ratios: House Prices and Fundamental Value. Kainer and Wei presented a price-to-rent ratio using the OFHEO house price index and the Owners' Equivalent Rent (OER) from the BLS.
 Here is a similar graph using the Case-Shiller National, Composite 20 and CoreLogic House Price Indexes.
This graph shows the price to rent ratio (January 1998 = 1.0).
On a price-to-rent basis, the Case-Shiller National index is back to Q3 1999 levels, the Composite 20 index is back to June 2000 levels, and the CoreLogic index is back to August 2000.
In real terms - and as a price-to-rent ratio - prices are mostly back to late 1990s or early 2000 levels.
Case-Shiller: House Prices increased 0.5% year-over-year in June
by Calculated Risk on 8/28/2012 09:00:00 AM
S&P/Case-Shiller released the monthly Home Price Indices for June (a 3 month average of April, May and June).
This release includes prices for 20 individual cities, two composite indices (for 10 cities and 20 cities) and the quarterly national index.
Note: Case-Shiller reports NSA, I use the SA data.
From S&P: Home Prices Rose in the Second Quarter of 2012 According to the S&P/Case-Shiller Home Price Indices
Data through June 2012, released today by S&P Dow Jones Indices for its S&P/Case-Shiller Home Price Indices ... showed that all three headline composites ended the second quarter of 2012 with positive annual growth rates for the first time since the summer of 2010. The national composite was up 1.2% in the second quarter of 2012 versus the second quarter of 2011, and was up 6.9% versus the first quarter of 2012. The 10- and 20-City Composites posted respective annual returns of +0.1% and +0.5% in June 2012. Month-over-month, average home prices in the 10-City Composite were up 2.2% and in the 20-City Composite were up 2.3% versus May. For the second consecutive month, all 20 cities and both Composites recorded positive monthly gains. Eighteen of the 20 MSAs and both Composites posted better annual returns in June as compared to May 2012 – only Charlotte and Dallas saw a deceleration in their annual rates.
...
“Home prices gained in the second quarter,” says David M. Blitzer, Chairman of the Index Committee at S&P Dow Jones Indices. “In this month’s report all three composites and all 20 cities improved both in June and through the entire second quarter of 2012. All 20 cities and both monthly Composites rose for the second consecutive month. It would have been a third consecutive month had we not seen home prices fall in Detroit back in April."
 Click on graph for larger image.
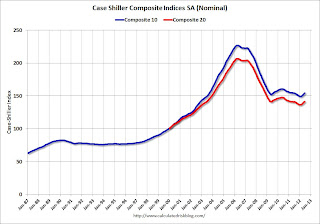
 The first graph shows the nominal seasonally adjusted Composite 10 and Composite 20 indices (the Composite 20 was started in January 2000).
The Composite 10 index is off 32.0% from the peak, and up 1.0% in June (SA). The Composite 10 is up 3.5% from the post bubble low set in March (SA).
The Composite 20 index is off 31.6% from the peak, and up 0.9% (SA) in June. The Composite 20 is up 3.6% from the post-bubble low set in March (SA).
 The second graph shows the Year over year change in both indices.
The Composite 10 SA is up 0.1% compared to June 2011.
The Composite 20 SA is up 0.5% compared to June 2011. This was the first year-over-year since 2010 (when the tax credit boosted prices temporarily).
The third graph shows the price declines from the peak for each city included in S&P/Case-Shiller indices.
 Prices increased (SA) in 18 of the 20 Case-Shiller cities in June seasonally adjusted (all 20 cities increased NSA). Prices in Las Vegas are off 60.0% from the peak, and prices in Dallas only off 6.0% from the peak. Note that the red column (cumulative decline through June 2012) is above previous declines for all cities.
This was better than the consensus forecast and the change to a year-over-year increase is significant. I'll have more on prices later.
Report: ECB President Draghi to Skip Jackson Hole
by Calculated Risk on 8/28/2012 08:42:00 AM
From Reuters: Draghi Skips Jackson Hole Ahead of Pivotal ECB Meeting
European Central Bank President Mario Draghi will not attend the annual Jackson Hole meeting of central bankers at the end of this week due to a heavy workload, the ECB said on Tuesday as its policymakers gear up for a critical meeting on Sept. 6.No speech on Saturday (Bernanke speaks on Friday at the Jackson Hole Economic Symposium).
Draghi had been expected to speak at the Jackson Hole gathering, but the retreat in the U.S. state of Wyoming falls just as ECB policymakers are hammering out the details of a new bond-buying plan aimed at tackling the euro zone debt crisis.
When asked whether Draghi was no longer planning to attend the Jackson Hole meeting, an ECB spokesman said: "That's correct ... He has a very heavy workload in the coming days."


