by Calculated Risk on 3/13/2012 02:16:00 PM
Tuesday, March 13, 2012
FOMC Statement: No changes, economy "expanding moderately"
Information received since the Federal Open Market Committee met in January suggests that the economy has been expanding moderately. Labor market conditions have improved further; the unemployment rate has declined notably in recent months but remains elevated. Household spending and business fixed investment have continued to advance. The housing sector remains depressed. Inflation has been subdued in recent months, although prices of crude oil and gasoline have increased lately. Longer-term inflation expectations have remained stable.
Consistent with its statutory mandate, the Committee seeks to foster maximum employment and price stability. The Committee expects moderate economic growth over coming quarters and consequently anticipates that the unemployment rate will decline gradually toward levels that the Committee judges to be consistent with its dual mandate. Strains in global financial markets have eased, though they continue to pose significant downside risks to the economic outlook. The recent increase in oil and gasoline prices will push up inflation temporarily, but the Committee anticipates that subsequently inflation will run at or below the rate that it judges most consistent with its dual mandate.
To support a stronger economic recovery and to help ensure that inflation, over time, is at the rate most consistent with its dual mandate, the Committee expects to maintain a highly accommodative stance for monetary policy. In particular, the Committee decided today to keep the target range for the federal funds rate at 0 to 1/4 percent and currently anticipates that economic conditions--including low rates of resource utilization and a subdued outlook for inflation over the medium run--are likely to warrant exceptionally low levels for the federal funds rate at least through late 2014.
The Committee also decided to continue its program to extend the average maturity of its holdings of securities as announced in September. The Committee is maintaining its existing policies of reinvesting principal payments from its holdings of agency debt and agency mortgage-backed securities in agency mortgage-backed securities and of rolling over maturing Treasury securities at auction. The Committee will regularly review the size and composition of its securities holdings and is prepared to adjust those holdings as appropriate to promote a stronger economic recovery in a context of price stability.
Voting for the FOMC monetary policy action were: Ben S. Bernanke, Chairman; William C. Dudley, Vice Chairman; Elizabeth A. Duke; Dennis P. Lockhart; Sandra Pianalto; Sarah Bloom Raskin; Daniel K. Tarullo; John C. Williams; and Janet L. Yellen. Voting against the action was Jeffrey M. Lacker, who does not anticipate that economic conditions are likely to warrant exceptionally low levels of the federal funds rate through late 2014.
State Unemployment Rates "generally lower" in January
by Calculated Risk on 3/13/2012 12:19:00 PM
From the BLS: Regional and State Employment and Unemployment Summary
Regional and state unemployment rates were generally lower in January. Forty-five states and the District of Columbia recorded unemployment rate decreases, New York posted a rate increase, and four states had no change, the U.S. Bureau of Labor Statistics reported today. Forty-eight states and the District of Columbia registered unemployment rate decreases from a year earlier, while New York experienced an increase and Illinois had no change.
...
Nevada continued to record the highest unemployment rate among the states, 12.7 percent in January. California and Rhode Island posted the next highest rates, 10.9 percent each. North Dakota again registered the lowest jobless rate, 3.2 percent, followed by Nebraska, 4.0 percent. ...
 Click on graph for larger image in graph gallery.
This graph shows the current unemployment rate for each state (red), and the max during the recession (blue). Every state has some blue - indicating no state is currently at the maximum during the recession.
The states are ranked by the highest current unemployment rate. Only four states still have double digit unemployment rates: Nevada, California, Rhode Island and North Carolina. This is the fewest since January 2009. In early 2010, 18 states and D.C. had double digit unemployment rates.
BLS: Job Openings unchanged in January
by Calculated Risk on 3/13/2012 10:00:00 AM
From the BLS: Job Openings and Labor Turnover Summary
The number of job openings in January was 3.5 million, unchanged from December. Although the number of job openings remained below the 4.3 million openings when the recession began in December 2007, the number of job openings has increased 45 percent since the end of the recession in June 2009.The following graph shows job openings (yellow line), hires (dark blue), Layoff, Discharges and other (red column), and Quits (light blue column) from the JOLTS.
...
In January, the hires rate was essentially unchanged at 3.1 percent for total nonfarm. ... The quits rate can serve as a measure of workers’ willingness or ability to change jobs. In January, the quits rate was unchanged for total nonfarm, total private, and government. ... The number of quits (not seasonally adjusted) in January 2012 increased from January 2011 for total nonfarm, total private, and government.
This is a new series and only started in December 2000.
Note: The difference between JOLTS hires and separations is similar to the CES (payroll survey) net jobs headline numbers. This report is for January, the most recent employment report was for February.
 Click on graph for larger image.
Notice that hires (dark blue) and total separations (red and light blue columns stacked) are pretty close each month. When the blue line is above the two stacked columns, the economy is adding net jobs - when it is below the columns, the economy is losing jobs.
Jobs openings were unchanged in January, and the number of job openings (yellow) has generally been trending up, and are up about 21% year-over-year compared to January 2011.
Quits declined slightly in January, and quits are now up about 9% year-over-year. These are voluntary separations and more quits might indicate some improvement in the labor market. (see light blue columns at bottom of graph for trend for "quits").
Retail Sales increased 1.1% in February
by Calculated Risk on 3/13/2012 08:30:00 AM
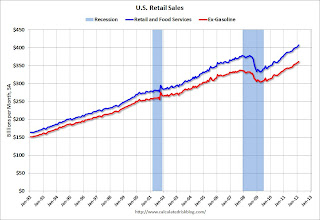
On a monthly basis, retail sales were up 1.1% from January to February (seasonally adjusted, after revisions), and sales were up 6.5% from February 2011. From the Census Bureau report:
The U.S. Census Bureau announced today that advance estimates of U.S. retail and food services sales for February, adjusted for seasonal variation and holiday and trading-day differences, but not for price changes, were $407.8 billion, an increase of 1.1 percent (±0.5%) from the previous month and 6.5 percent (±0.7%) above February 2011. ... The December 2011 to January 2012 percent change was revised from 0.4 percent (±0.5)* to 0.6 percent (±0.2%).Ex-autos, retail sales increased 0.9% in February.
 Click on graph for larger image.
Sales for January were revised up from a 0.4% increase to a 0.6% increase.
This graph shows retail sales since 1992. This is monthly retail sales and food service, seasonally adjusted (total and ex-gasoline).
Retail sales are up 22.6% from the bottom, and now 7.8% above the pre-recession peak (not inflation adjusted)
 The second graph shows the same data since 2006 (to show the recent changes). Excluding gasoline, retail sales are up 18.8% from the bottom, and now 6.9% above the pre-recession peak (not inflation adjusted).
The third graph shows the year-over-year change in retail sales and food service (ex-gasoline) since 1993.
Retail sales ex-gasoline increased by 6.0% on a YoY basis (6.5% for all retail sales). Retail sales ex-gasoline increased 0.8% in February.
 This was below the consensus forecast for retail sales of a 1.2% increase in February, but above the consensus for a 0.8% increase ex-auto.
 NFIB: Small Business Optimism increases slightly in February
by Calculated Risk on 3/13/2012 07:45:00 AM
From the National Federation of Independent Business (NFIB): Historically Low Business Confidence Begins to Edge Up, Ever so Slightly
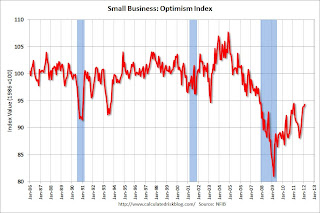
The Small-Business Optimism Index gained 0.4 points in February to 94.3 marking the sixth consecutive month of gains. While still historically low, the latest increase is a sign that the recovery is likely to continue, albeit at a glacial pace. The Index is lower than that of February 2011 but is the second highest reading since December 2007, the beginning of the recession.Note: Small businesses have a larger percentage of real estate and retail related companies than the overall economy.
...
While the fog over Main Street appears to be lifting to some degree, confidence in the economy remains fragile. Twenty-two (22) percent of small-business owners report “poor sales” as their top business problem, unchanged from January. February’s report suggests cautious optimism ...
 Click on graph for larger image.
This graph shows the small business optimism index since 1986. The index increased to 94.3 in February from 93.9 in January. This is the sixth increase in a row after for the index, and the index is now at second highest level since December 2007 (the index was slightly higher - at 94.5 - in February 2011).
This index is still low - probably due to a combination of sluggish growth, and the high concentration of real estate related companies in the index.


