by Calculated Risk on 10/28/2011 08:30:00 AM
Friday, October 28, 2011
Personal Income increased 0.1% in September, Spending increased 0.6%
The BEA released the Personal Income and Outlays report for September:
Personal income increased $17.3 billion, or 0.1 percent ... in September ... Personal consumption expenditures (PCE) increased $68.7 billion, or 0.6 percent.The following graph shows real Personal Consumption Expenditures (PCE) through August (2005 dollars). Note that the y-axis doesn't start at zero to better show the change.
...
Real PCE -- PCE adjusted to remove price changes -- increased 0.5 percent in September, in contrast to a decrease of less than 0.1 percent in August. ... PCE price index -- The price index for PCE increased 0.2 percent in September, compared with an increase of 0.3 percent in August. The PCE price index, excluding food and energy, decreased less than 0.1 percent.
 Click on graph for larger image.
PCE increased 0.6 in September, and real PCE increased 0.5%.
Note: The PCE price index, excluding food and energy, decreased 0.2 percent.
The personal saving rate was at 3.6% in Setpember.
Personal saving -- DPI less personal outlays -- was $419.8 billion in September, compared with $479.1 billion in August. Personal saving as a percentage of disposable personal income was 3.6 percent in September, compared with 4.1 percent in August.
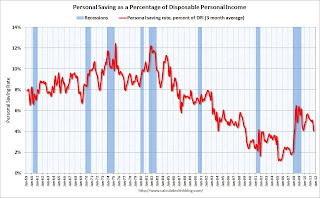 This graph shows the saving rate starting in 1959 (using a three month trailing average for smoothing) through the September Personal Income report.
Spending is growing faster than incomes - and the saving rate has been declining. That can't continue for long ...
Thursday, October 27, 2011
California Gov. Jerry Brown proposes State Pension Changes
by Calculated Risk on 10/27/2011 11:52:00 PM
If this moves forward, this might become a model for other states. A big "if" ...
From the LA Times: Gov. Jerry Brown risks backlash on pension plan
Brown's 12-point plan, announced Thursday, would require that all public workers have at least half the cost of their pensions deducted from their paychecks. ...
The governor also wants future employees to receive up to a third of their retirement income from a 401(k)-style plan rather than a traditional guaranteed pension. And he urged that the retirement age for most new public workers be raised from 55 to 67.Earlier on GDP:
• GDP slightly above pre-recession peak, Investment Contributions
• Advance Estimate: Real Annualized GDP Grew at 2.5% in Q3
• GDP Graphs
Strong Auto Sales growth seen in October
by Calculated Risk on 10/27/2011 08:50:00 PM
It looks like auto sales are fairly strong in October ...
From Edmunds.com: Edmunds.com October Auto Sales Forecast: Momentum Is Strong, But it May be a Bubble
An estimated 1,033,257 new cars will be sold in October, for a projected Seasonally Adjusted Annual Rate (SAAR) of 13.4 million units, forecasts Edmunds.com ... This sales pace would mark the highest monthly SAAR since August 2009, when sales were inflated by the Cash for Clunkers program.From Truecar.com: New Vehicle Sales Expected to Reach Highest SAAR Since August 2009 According to TrueCar.com
Edmunds.com analysts attribute October’s sales results to the release of pent-up demand that has been building for more than a year. As a result, the auto industry may be in the midst of a small sales bubble.
“October’s sales numbers are certainly a bright spot in a sluggish economy, but it would be a mistake to believe that this momentum is the ‘new normal,’ said Jessica Caldwell, senior analyst at Edmunds.com. “Unless early holiday incentives inspire droves of buyers in November, we don’t expect sales to increase on the same trajectory as we have seen in the last two months.”
For October 2011, new light vehicle sales in the U.S. (including fleet) is expected to be 1,035,042 units, up 9.0 percent from October 2010 and down 1.7 percent from September 2011 (on an unadjusted basis)
The October 2011 forecast translates into a Seasonally Adjusted Annualized Rate (SAAR) of 13.4 million new car sales, up from 13.1 million in September 2011 and up from 12.2 million in October 2010.
 Click on graph for larger image.
Sales in Q3 were up slightly from Q2, although - as part of the Q3 GDP release - the BEA estimated motor vehicles and parts made a small negative contribution to GDP in Q3 (probably due to mix of vehicles).
If sales are at this forecast for October - and just hold this level in November and December - vehicle sales will make a strong contribution to Q4 GDP.
Misc: Fannie/Freddie Investor REO Buying, Pending Home Sales down, Kansas City Manufacturing edges higher
by Calculated Risk on 10/27/2011 04:43:00 PM
Just catching up ...
• Last Sunday, I mentioned a rumor that a new program for investors to buy (and rent) foreclosed houses from Fannie and Freddie would be announced soon. Diana Olick at CNBC writes today: Investors Raising Cash to Buy Government Foreclosures
[T]he Obama Administration is pushing a potential [plan] to auction off foreclosed properties in bulk to investors, specifically the quarter of a million properties currently on the books of Fannie Mae, Freddie Mac and the FHA. As demand for single family rental properties rises, so too do potential investor returns.• From the Kansas City Fed: Growth in Manufacturing Activity Edged Higher
"There is a hope that we'll be able to do a pilot in the near future, perhaps by the end of 2011 or early 2012. However, there hasn't been any decision on timing yet," according to an administration source.
Growth in Tenth District manufacturing activity edged higher in October. Expectations for future activity rebounded after easing somewhat the past few months. ... The month-over-month composite index was 8 in October, up from 6 in September and 3 in August ... the employment index remained unchanged [at 12].• From Freddie Mac:
30-year fixed-rate mortgage (FRM) averaged 4.10 percent with an average 0.8 point for the week ending October 27, 2011, down from last week when it averaged 4.11 percent. Last year at this time, the 30-year FRM averaged 4.23 percent.• From NAR: September Pending Home Sales Down, Still Higher Than a Year Ago
The Pending Home Sales Index ... fell 4.6 percent to 84.5 in September from 88.6 in August but is 6.4 percent higher than September 2010 when it stood at 79.4.
Earlier on GDP:
• GDP slightly above pre-recession peak, Investment Contributions
• Advance Estimate: Real Annualized GDP Grew at 2.5% in Q3
• GDP Graphs
NMHC Apartment Survey: Market Conditions Tighten Slightly in Recent Survey
by Calculated Risk on 10/27/2011 03:07:00 PM
From the National Multi Housing Council (NMHC): Development Ramps Up as Demand Swells Finds NMHC Quarterly Survey
Increased demand for rental housing has led to a considerable uptick in multifamily construction, finds the National Multi Housing Council’s (NMHC) latest Quarterly Survey of Apartment Market Conditions.
The pace of development activity has increased in most markets. Two-thirds (67%) of respondents noted considerable activity, either in the planning stage or actual new construction. In particular, 20% said developers are breaking [ground] on new projects at a rapid clip. The other 47% reported an increase in pre-construction activities—acquiring land, lining up financing, getting building permits—but not much actual construction yet.
Even with this increased activity, more than half (54%) think new development remains considerably below demand.
"Powerful demographic trends along with changing attitudes about homeownership and tighter mortgage underwriting continue to drive a shift toward renting, which is fueling a ramp up in new construction," noted NMHC Chief Economist Mark Obrinsky. "While some survey respondents expressed concern over sporadic overbuilding, others noted that the lack of construction financing may prevent some developments from actually breaking ground."
Overall, the apartment market continued its healthy growth, although there is some evidence of a slowdown. For the sixth time in the last seven quarters, all four market indexes were above 50—a reading above 50 indicates improving market conditions—although all four fell, suggesting less widespread growth than the prior quarter.
"A narrowing in the extent of the improvement is not unexpected after almost two years of strong gains," said Obrinsky. "As long as the economy continues to generate jobs, the apartment upswing should remain on track."

Click on graph for larger image.
This graph shows the quarterly Apartment Tightness Index.
The index has indicated tighter market conditions for the last seven quarters and although down from the record 90 earlier this year, this still suggests falling vacancy rates and or rising rents.
This fits with the recent Reis data showing apartment vacancy rates fell in Q3 2011 to 5.6%, down from 6.0% in Q2 2011, and 9.0% at the end of 2009. Based on this index, I expect the declines in vacancy rates to slow.
New multi-family construction is one of the few bright spots for the U.S. economy and this survey indicates demand for apartments is still strong.
A final note: This index helped me call the bottom for effective rents (and the top for vacancy rate) early last year.
Hotels: Occupancy Rate increases 4% year-over-year
by Calculated Risk on 10/27/2011 01:14:00 PM
From HotelNewsNow.com: Miami reports strongest weekly RevPAR gain
Overall, the U.S. hotel industry’s occupancy rose 4% to 66.2%, average daily rate increased 4.4% to US$105.49, and RevPAR finished the week up 8.6% to US$69.88.Note: ADR: Average Daily Rate, RevPAR: Revenue per Available Room.
The following graph shows the seasonal pattern for the hotel occupancy rate using a four week average for the occupancy rate.
 Click on graph for larger image.
We are now in the fall business travel season. The 4-week average of the occupancy rate has increased again seasonally. In September, the 4-week average was back to the pre-recession median, but October fall business travel was less than normal - but still better than last year.
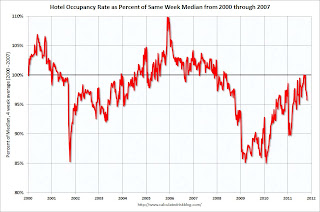 The second graph shows the 4-week average of the occupancy rate as a percent of the median since 2000. Note: Since this is a percent of the median, the number can be above 100%.
This shows the decline in the occupancy rate during and following the 2001 recession. The sharp decline in 2001 was related to 9/11, and the sharp increase towards the end of 2005 was due to Hurricane Katrina.
The occupancy rate really fell off a cliff in 2008. After briefly recovering to the median, this measure has declined over the last month.
Data Source: Smith Travel Research, Courtesy of HotelNewsNow.com
GDP slightly above pre-recession peak, Investment Contributions
by Calculated Risk on 10/27/2011 10:37:00 AM
According to the Bureau of Economic Analysis (BEA), real GDP is finally just above the pre-recession peak. The estimate for real GDP in Q3 (2005 dollars) was $13,352.8 billion, 0.2% above the $13,326.0 billion in Q4 2007. Nominal GDP was reported as $15,198.6 billion in Q3 2011.
The following graph is constructed as a percent of the previous peak. This shows when GDP has bottomed - and when GDP has returned to the level of the previous peak. If the indicator is at a new peak, the value is 100%.
At the worst point, real GDP was off 5.1% from the 2007 peak. Since the most common definition of a depression is a 10%+ decline in real GDP, the 2007 recession was not a depression. Note: There is no formal definition of a depression. Some people use other definitions such as the duration below the previous peak. By that definition, using both GDP and employment, this seems like the "Lesser depression", but not by the common definition.
 Click on graph for larger image.
This graph is for real GDP through Q3 2011 and shows real GDP is back to the the pre-recession peak.
Note: There are really two measures of GDP: 1) real GDP, and 2) real Gross Domestic Income (GDI). The BEA will release GDI with the 2nd GDP estimate for Q3. GDI was back to the pre-recession peak in Q2.
The following graph shows the rolling 4 quarter contribution to GDP from residential investment, equipment and software, and nonresidential structures. This is important to follow because residential investment tends to lead the economy, equipment and software is generally coincident, and nonresidential structure investment trails the economy.
For the following graph, red is residential, green is equipment and software, and blue is investment in non-residential structures. The usual pattern - both into and out of recessions is - red, green, blue.
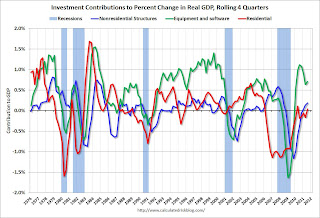 Residential Investment (RI) made a positive contribution to GDP in Q3 2011, and the four quarter rolling average finally turned positive in Q3.
Equipment and software investment has made a significant positive contribution to GDP for nine straight quarters (it is coincident).
The contribution from nonresidential investment in structures was positive in Q3. Nonresidential investment in structures typically lags the recovery, however investment in energy and power is masking weakness in office, mall and hotel investment (the underlying details will be released next week).
The key leading sector - residential investment - has lagged this recovery because of the huge overhang of existing inventory. Usually RI is a strong contributor to GDP growth and employment in the early stages of a recovery, but not this time - and this is a key reason why the recovery has been sluggish so far.
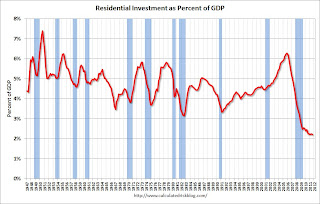 Although Residential Investment (RI) increased slightly in Q3, RI as a percent of GDP declined slightly - and RI as a percent of GDP is at a new record low.
I'll break down Residential Investment (RI) into components after the GDP details are released this coming week. Note: Residential investment (RI) includes new single family structures, multifamily structures, home improvement, broker's commissions, and a few minor categories.
As expected, RI is increasing slowly in 2011 and it looks like RI will add to both GDP and employment growth - for the first time since 2005. It won't be much, but it will probably be positive.
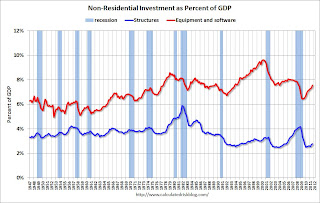 The last graph shows non-residential investment in structures and equipment and software.
Equipment and software investment has been increasing sharply, however several tech companies have lowered their outlooks - so investment in equipment and software might slow in Q4.
Non-residential investment in structures increased in Q3. I'll add details for investment in offices, malls and hotels next week.
Earlier ...
• Advance Estimate: Real Annualized GDP Grew at 2.5% in Q3
Weekly Initial Unemployment Claims decline slightly
by Calculated Risk on 10/27/2011 08:51:00 AM
The DOL reports:
In the week ending October 22, the advance figure for seasonally adjusted initial claims was 402,000, a decrease of 2,000 from the previous week's revised figure of 404,000. The 4-week moving average was 405,500, an increase of 1,750 from the previous week's revised average of 403,750.The following graph shows the 4-week moving average of weekly claims since January 2000:

Click on graph for larger image.
The dashed line on the graph is the current 4-week average. The four-week average of weekly unemployment claims increased this week to 405,500.
This is down from September, but still elevated - and still above the post-recession lows of earlier this year.
The next graph shows the 4-week average since 1971:

Advance Estimate: Real Annualized GDP Grew at 2.5% in Q3
by Calculated Risk on 10/27/2011 08:30:00 AM
Real gross domestic product -- the output of goods and services produced by labor and property located in the United States -- increased at an annual rate of 2.5 percent in the third quarter of 2011 (that is, from the second quarter to the third quarter) according to the "advance" estimate released by the Bureau of Economic Analysis.The following graph shows the quarterly GDP growth (at an annual rate) for the last 30 years. The dashed line is the current growth rate. Growth in Q2 at 2.5% annualized was below trend growth (around 3%) - and very weak for a recovery, especially with all the slack in the system.
The acceleration in real GDP in the third quarter primarily reflected accelerations in PCE and in nonresidential fixed investment and a smaller decrease in state and local government spending that were partly offset by a larger decrease in private inventory investment.
A few key numbers:
• Real personal consumption expenditures increased 2.4 percent in the second quarter, compared with an increase of 0.7 percent in the second.
• Change in private inventories subtracted 1.08 percentage point.
• Investment: "Real nonresidential fixed investment increased 16.3 percent in the third quarter, compared with an increase of 10.3 percent in the second. Nonresidential structures increased 13.3 percent, compared with an increase of 22.6 percent. Equipment and software increased 17.4 percent, compared with an increase of 6.2 percent. Real residential fixed investment increased 2.4 percent, compared with an increase of 4.2 percent.."
I'll have much more later today ...
Wednesday, October 26, 2011
Euro Summit Statement
by Calculated Risk on 10/26/2011 10:49:00 PM
EURO SUMMIT STATEMENT. Excerpts:
The Private Sector Involvement (PSI) has a vital role in establishing the sustainability of the Greek debt. Therefore we welcome the current discussion between Greece and its private investors to find a solution for a deeper PSI. Together with an ambitious reform programme for the Greek economy, the PSI should secure the decline of the Greek debt to GDP ratio with an objective of reaching 120% by 2020. To this end we invite Greece, private investors and all parties concerned to develop a voluntary bond exchange with a nominal discount of 50% on notional Greek debt held by private investors. The Euro zone Member States would contribute to the PSI package up to 30 bn euro. On that basis, the official sector stands ready to provide additional programme financing of up to 100 bn euro until 2014, including the required recapitalisation of Greek banks. The new programme should be agreed by the end of 2011 and the exchange of bonds should be implemented at the beginning of 2012. We call on the IMF to continue to contribute to the financing of the new Greek programme.On EFSF:
We agree that the capacity of the extended EFSF shall be used with a view to maximizing the available resources in the following framework:UPDATE: IIF Statement: (ht Brian)
• the objective is to support market access for euro area Member States faced with market pressures and to ensure the proper functioning of the euro area sovereign debt market, while fully preserving the high credit standing of the EFSF. These measures are needed to ensure financial stability and provide sufficient ringfencing to fight contagion;
• this will be done without extending the guarantees underpinning the facility and within the rules of the Treaty and the terms and conditions of the current framework agreement, operating in the context of the agreed instruments, and entailing appropriate conditionality and surveillance.
19. We agree on two basic options to leverage the resources of the EFSF:
• providing credit enhancement to new debt issued by Member States, thus reducing the funding cost. Purchasing this risk insurance would be offered to private investors as an option when buying bonds in the primary market;
• maximising the funding arrangements of the EFSF with a combination of resources from private and public financial institutions and investors, which can be arranged through Special Purpose Vehicles. This will enlarge the amount of resources available to extend loans, for bank recapitalization and for buying bonds in the primary and secondary markets.
20. The EFSF will have the flexibility to use these two options simultaneously, deploying them depending on the specific objective pursued and on market circumstances. The leverage effect of each option will vary, depending on their specific features and market conditions, but could be up to four or five.
Institute of International Finance
October 27, 2011 – Brussels, Belgium:
The following statement was issued by Mr. Charles Dallara, Managing Director
of the Institute of International Finance:
We welcome the announcement by the leaders of the Euro Area of a
comprehensive package of measures to stabilize Europe, to strengthen the
European banking system and to support Greece's reform effort. On behalf of
the private investor community, the IIF agrees to work with Greece, Euro
Area authorities and the IMF to develop a concrete voluntary agreement on
the firm basis of a nominal discount of 50% on notional Greek debt held by
private investors with the support of a 30 billion Euro official PSI
package. This should set the basis for the decline of the Greek debt to GDP
ratio with an objective of reaching 120% by 2020.
The specific terms and conditions of the voluntary PSI will be agreed by all
relevant parties in the coming period and implemented with immediacy and
force. The structure of the new Greek claims will need to be based on terms
and conditions that ensure an NPV loss for investors fully consistent with a
voluntary agreement.


