by Calculated Risk on 7/24/2011 09:45:00 PM
Sunday, July 24, 2011
Subprime America?
They seem crazy, but are they insane? I don't think so. And investors don't think so either ... at least not yet.
The Asian markets are barely red tonight, with the Nikkei off 0.6%.
From CNBC: Pre-Market Data and Bloomberg futures: the S&P 500 is off about 11 points, and Dow futures are off about 105 points.
A couple of articles, but nothing new ...
From the WaPo: Debt-limit talks at a standstill as parallel strategies take shape in House, Senate
From the WSJ: Gridlock for Debt Talks
Yesterday:
• Summary for Week Ending July 22nd
• Schedule for Week of July 24th
Labor Force Participation Rate Update
by Calculated Risk on 7/24/2011 06:34:00 PM
Tracking the participation rate for various age groups monthly is a little like watching paint dry, but the trends are important. Here is a look at some the long term trends (updated graphs through June 2011).
The following graph shows the changes in the participation rates for men and women since 1960 (in the 25 to 54 age group - the prime working years).
The participation rate for women increased significantly from the mid 30s to the mid 70s and has mostly flattened out - although the rate has been declining recently (down to 74.6% in June). The participation rate for men has decreased from the high 90s to 89.0% in June 2011. (down slightly from May)
 Click on graph for larger image in graph gallery.
There will probably be some "bounce back" for both men and women (some of the recent decline is probably cyclical), but the long term trend for men is down.
The next graph shows that participation rates for several key age groups.
There are a few key long term trends:
• The participation rate for the '16 to 19' age group has been falling for some time (red). This at 34% in June.
 • The participation rate for the 'over 55' age group has been rising since the mid '90s (purple), although this has stalled out a little recently (perhaps cyclical).
• The participation rate for the '20 to 24' age group fell recently too (perhaps more people are focusing on eduction before joining the labor force). This appears to have stabilized - although it was down to 70.5% in June, and I expect the participation rate to increase for this cohort as the job market improves.
 The third graph shows the participation rate for several over 55 age groups. The red line is the '55 and over' total seasonally adjusted. All of the other age groups are Not Seasonally Adjusted (NSA).
The participation rate is generally trending up for all older age groups.
The increase in participation of older cohorts might push up the overall participation rate over the next few years, however eventually the 'over 55' participation rate will start to decline as the oldest baby boomers move into even older age groups.
I've been expecting some small bounce back in the participation rate, but I don't think the bounce back will be huge - and we haven't seen it yet. This will be a key number to watch over the next few years.
Yesterday:
• Summary for Week Ending July 22nd
• Schedule for Week of July 24th
Q2 GDP Forecasts and Revisions
by Calculated Risk on 7/24/2011 01:40:00 PM
Probably the key economic release this coming week is the advance estimate of Q2 GDP on Friday. The consensus is that real GDP increased 1.8% annualized in Q2. Note: Bloomberg is showing the consensus as 1.9%. Goldman Sachs is forecasting "real GDP growth decelerated further in Q2, to an annualized growth rate of just 1.5%".
In addition to the advance release of GDP, the Bureau of Economic Analysis will release revisions for the previous three years:
On July 29, 2011, the Bureau of Economic Analysis will release the results of the annual revision of the national income and product accounts (NIPAs) together with the advance estimate of gross domestic product (GDP) for the second quarter of 2011. In addition to the regular revision of estimates for the most recent 3 years and for the first quarter of 2011, this “flexible” annual revision will result in revisions to GDP and some components back to the first quarter of 2003.My guess is the revisions will show the recovery has been weaker than the original estimates indicated.
 Click on graph for larger image in graph gallery.
This graph shows the quarterly GDP growth (at an annual rate) for the last 30 years.
The consensus is that real GDP increased 1.8% annualized in Q2. The estimate for Q2 is in blue.
Back-to-back weak quarters and a sluggish and choppy recovery ...
Yesterday:
• Summary for Week Ending July 22nd
• Schedule for Week of July 24th
Debt Ceiling Charade: The Smart Options
by Calculated Risk on 7/24/2011 09:34:00 AM
Ezra Klein outlined three possible options: 11 days until disaster, three options to prevent it
At this point, there are three serious options on the table. A $4 trillion deal that includes some revenues, a $1 trillion-$2 trillion deal that’s all spending cuts but leaves much of the job until after the election, and a deal in which Republicans don’t come to a negotiated agreement with President Obama but they grant him the authority -- and let him take the blame -- for raising the debt ceiling. Those are our three options, and Congress needs to pick one.From a pure economic perspective, here are the best options (#1 is best):
Option #1: Eliminate the debt ceiling. The debt ceiling is a joke. It serves no purpose except political posturing. It is not about the deficit - it is about paying the bills, and the U.S. will pay the bills. I've been making this argument for months. Moody's made the same argument last week: Moody's suggests U.S. eliminate debt ceiling
The United States is one of the few countries where Congress sets a ceiling on government debt, which creates "periodic uncertainty" over the government's ability to meet its obligations, Moody's said in a report.Unfortunately some politicians forgot the debt ceiling is just for posing, and they have overplayed a non-existent hand. From the NY Times:
"We would reduce our assessment of event risk if the government changed its framework for managing government debt to lessen or eliminate that uncertainty," Moody's analyst Steven Hess wrote in the report.
“Our problem is, we made a big deal about this for three months,” said Senator Lindsey Graham, Republican of South Carolina.Option #2: Pass a "clean" bill raising the debt ceiling enough to get through the next election (so the politicians don't have to embarrass themselves again). Congress could do this at any time. That is why voters would blame the party controlling the House if the debt ceiling is not raised. As Republican Senator Mitch McConnell recently noted, if the debt ceiling isn't raised the "Republican brand" would become toxic and synonymous with fiscal irresponsibility.
“How many Republicans have been on TV saying, ‘I am not going to raise the debt limit,’ ” said Mr. Graham, including himself in the mix of those who did so. “We have no one to blame but ourselves.”
Option #3: The McConnell Option. This is the agreement Klein noted to give President Obama the authority to increase the debt ceiling, and try to blame Obama for the increases.
Those are the smart options. Reaching some vague non-binding agreement on some future spending cuts might soothe some pain, but it would just lead to more articles about how the cuts aren't real.
I'd praise the GOP if they selected Option #1 or even Option #2. This charade has been the worst of American politics. I'll be happy when it is over.
Yesterday (on the economy):
• Summary for Week Ending July 22nd
• Schedule for Week of July 24th
Saturday, July 23, 2011
DOT: Vehicle Miles Driven decreased -1.9% in May compared to May 2010
by Calculated Risk on 7/23/2011 10:06:00 PM
Earlier:
• Summary for Week Ending July 22nd
• Schedule for Week of July 24th
This data is for May and gasoline prices were at the highest level of the year at end of April and into early May - so the YoY decline might be less in June.
The Department of Transportation (DOT) reported Friday:
Travel on all roads and streets changed by -1.9% (-5.0 billion vehicle miles) for May 2011 as compared with May 2010. Travel for the month is estimated to be 254.0 billion vehicle miles.
Cumulative Travel for 2011 changed by -1.0% (-11.7 billion vehicle miles).
 Click on graph for larger image in graph gallery.
This graph shows the rolling 12 month total vehicle miles driven.
In the early '80s, miles driven (rolling 12 months) stayed below the previous peak for 39 months. Currently miles driven has been below the previous peak for 42 months - so this is a new record for longest period below the previous peak - and still counting!
Note: some people have asked about miles driven on a per capita basis (or per registered driver), and I'm looking at the data.
 The second graph shows the year-over-year change from the same month in the previous year. So far the current decline is not as a severe as in 2008.
With the decline in oil and gasoline prices, the YoY decline in miles driven will probably not be as large in June.
Schedule for Week of July 24th
by Calculated Risk on 7/23/2011 05:40:00 PM
Earlier:
• Summary for Week Ending July 22nd
The key economic report for the coming week is the Q2 advance GDP report to be released on Friday. There are also two important housing reports to be released early in the week: New Home sales and Case-Shiller house prices, both on Tuesday.
8:30 AM ET: Chicago Fed National Activity Index (June). This is a composite index of other data.
10:30 AM: Dallas Fed Manufacturing Survey for July. The Texas production index fell to 5.6 in June (still expansion).
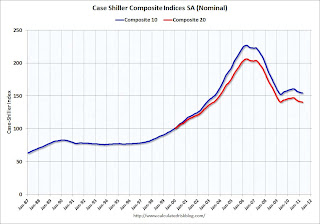 9:00 AM: S&P/Case-Shiller Home Price Index for May. Although this is the May report, it is really a 3 month average of March, April and May. The consensus is for flat prices in May, however I expect prices to increase NSA.
 This graph shows the seasonally adjusted Composite 10 and Composite 20 indices through April (the Composite 20 was started in January 2000).
The Composite 10 index is off 31.8% from the peak, and was up slightly in April (SA). The Composite 20 index is off 31.8% from the peak, and was down slightly in April (SA).
 10:00 AM: New Home Sales for June from the Census Bureau.
 This graph shows New Home Sales since 1963. The dashed line is the current sales rate.
The consensus is for a slight increase in sales to 321 thousand Seasonally Adjusted Annual Rate (SAAR) in June from 319 thousand in May.
10:00 AM: Richmond Fed Survey of Manufacturing Activity for July. The consensus is for the index to be at 4, up from 3 in June (above zero is expansion).
10:00 AM: Conference Board's consumer confidence index for July. The consensus is for a decrease to 56.
7:00 AM: The Mortgage Bankers Association (MBA) will release the mortgage purchase applications index. This index has been very weak over the last couple months suggesting weak home sales through summer (not counting all cash purchases).
8:30 AM: Durable Goods Orders for June from the Census Bureau. The consensus is for a 0.3% increase in durable goods orders after increasing 2.1% in May.
2:00 PM: Fed's Beige Book. This is an informal review by the Federal Reserve Banks of current economic conditions.
8:30 AM: The initial weekly unemployment claims report will be released. The number of claims has been elevated for the last couple of months. The consensus is for a decrease to 415,000 from 418,000 last week.
10:00 AM: Pending Home Sales Index for June. The consensus is for a 2.0% decrease in contracts signed. Economist Tom Lawler is forecasting a slight increase in pending home sales.
11:00 AM: Kansas City Fed regional Manufacturing Survey for July. The index was at 14 in June.
8:30 AM: Q2 GDP (advance release). This is the advance release from the BEA. The consensus is that real GDP increased 1.8% annualized in Q2.
9:45 AM: Chicago Purchasing Managers Index for July. The consensus is for a slight decrease to 60.2, down from 61.1 in June.
9:55 AM: Reuter's/University of Michigan's Consumer sentiment index (final for July). The consensus is for an increase to 64.0 from the preliminary reading of 63.8.
10:00 AM: Q2 Housing Vacancies and Homeownership report from the Census Bureau.
Summary for Week Ending July 22nd
by Calculated Risk on 7/23/2011 10:58:00 AM
The big story of the week was in Europe: Greece will default. Here is the statement: STATEMENT BY THE HEADS OF STATE OR GOVERNMENT OF THE EURO AREA AND EU INSTITUTIONS
This marks a significant step in the European financial crisis. The European leaders have finally recognized that the Greek debt burden must be reduced. Analysts are debating if this debt reduction is sufficient - probably not - and if other countries will need to default too. European leaders are adamant that private sector involvement is for Greece only. I have my doubts.
The U.S. data was mixed. There was a little good news in the housing sector including an increase in multifamily starts and in the remodeling index. Existing home sales were weak as expected, and the Architecture Billings Index (for commercial real estate) indicated contraction.
In manufacturing, the Philly Fed survey indicated a little expansion in July, from contraction in June.
Finally, the debt ceiling charade continued. As expected, no deficit reduction deal was reached, and we have now arrived at the final act. My guess is a deal will be reached to raise the debt ceiling, there will be a filibuster in the Senate, the House might reject the deal once, and then it will finally pass.
• Housing Starts increased in June
From the Census Bureau: Permits, Starts and Completions
Housing Starts:
Privately-owned housing starts in June were at a seasonally adjusted annual rate of 629,000. This is 14.6 percent (±10 9%) above the revised May estimate of 549,000 and is 16.7 percent (±11.8%) above the June 2010 rate of 539,000.
Single-family housing starts in June were at a rate of 453,000; this is 9.4 percent (±11.1%)* above the revised May figure of 414,000. The June rate for units in buildings with five units or more was 170,000.
 Click on graph for larger image in graph gallery.
Total housing starts were at 629 thousand (SAAR) in June, up 14.6% from the revised May rate of 549 thousand.
Single-family starts increased 9.4% to 453 thousand in June.
The second graph shows total and single unit starts since 1968.
 This shows the huge collapse following the housing bubble, and that housing starts have mostly been moving sideways for over two years - with slight ups and downs due to the home buyer tax credit.
This was above expectations of 575 thousand starts in June. Multi-family starts are increasing in 2011 - although from a very low level. This is one of the bright spots for construction and the economy this year.
• Existing Home Sales in June: 4.77 million SAAR, 9.5 months of supply
 The NAR reports: June Existing-Home Sales Slip on Contract Cancellations
This graph shows existing home sales, on a Seasonally Adjusted Annual Rate (SAAR) basis since 1993.
Sales in June 2011 (4.77 million SAAR) were 0.8% lower than last month, and were 8.8% lower than in June 2010.
According to the NAR, inventory increased to 3.77 million in June from 3.65 million in May.
 This graph shows the year-over-year (YoY) change in reported existing home inventory and months-of-supply. Since inventory is not seasonally adjusted, so it really helps to look at the YoY change. Note: Months-of-supply is based on the seasonally adjusted sales and not seasonally adjusted inventory.
Inventory decreased 3.1% year-over-year in June from June 2010. This is the fifth consecutive month with a YoY decrease in inventory.
Months of supply increased to 9.5 months in June, up from 9.1 months in May. These sales numbers were below the consensus, but close to Lawler's forecast was 4.71 million using the NAR method.
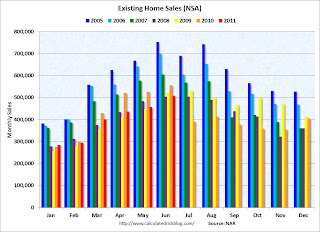 This graph shows existing home sales Not Seasonally Adjusted (NSA).
The red columns are for 2011.
Sales NSA are below the tax credit boosted level of sales in June 2010 and June 2009, but slightly above the level of June sales in 2008.
Last year sales collapsed in July (orange column - after the expiration of the tax credit), so expect a report of a large YoY increase in sales announced next month.
• AIA: Architecture Billings Index indicates declining demand in June
Note: This index is a leading indicator for new Commercial Real Estate (CRE) investment.
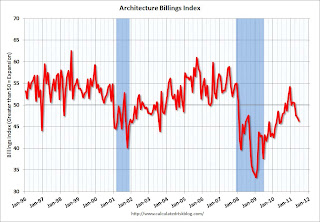 This graph shows the Architecture Billings Index since 1996. The index decreased in June to 46.3 from 47.2 in May. Anything below 50 indicates a contraction in demand for architects' services.
Note: Nonresidential construction includes commercial and industrial facilities like hotels and office buildings, as well as schools, hospitals and other institutions. Note that the government sector is the weakest. The American Recovery and Reinvestment Act of 2009 is winding down, and state and local governments are still cutting back.
According to the AIA, there is an "approximate nine to twelve month lag time between architecture billings and construction spending" on non-residential construction. So this suggests another dip in CRE investment in 2012.
• Residential Remodeling Index at new high in May
 The BuildFax Residential Remodeling Index was at 124.3 in May, up from 109.7 in April. This is based on the number of properties pulling residential construction permits in a given month.
 This is the highest level for the index (started in 2004) - even above the levels from 2004 through 2006 during the home equity ("home ATM") withdrawal boom.
Note: permits are not adjusted by value, so this doesn't mean there is more money being spent, just more permit activity. Also some smaller remodeling projects are done without permits and the index will miss that activity.
 Since there is a strong seasonal pattern for remodeling, the second graph shows the year-over-year change from the same month of the previous year.
The remodeling index is up 22% from May 2010.
Even though new home construction is still moving sideways, it appears that two other components of residential investment will increase in 2011: multi-family construction and home improvement.
Data Source: BuildFax, Courtesy of Index.BuildFax.com
• Moody's: Commercial Real Estate Prices increased in May
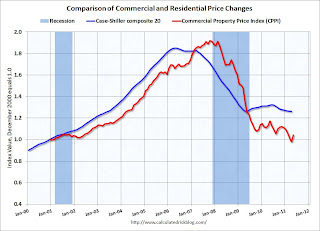 From Bloomberg: U.S. Commercial Property Prices Increased 6.3% in May, Moody’s Says
Here is a comparison of the Moodys/REAL Commercial Property Price Index (CPPI) and the Case-Shiller composite 20 index. CRE prices only go back to December 2000. The Case-Shiller Composite 20 residential index is in blue (with Dec 2000 set to 1.0 to line up the indexes).
According to Moody's, CRE prices are down 11% from a year ago and down about 46% from the peak in 2007. Prices fell sharply over the previous six months, and this increase only erases part of that decline.
Note: There are few commercial real estate transactions compared to residential, so this index is very volatile.
• Philly Fed Survey: "Regional manufacturing remained weak in July"
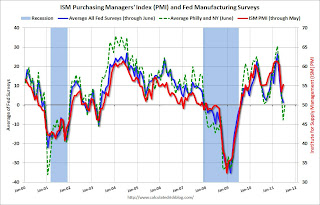 From the Philly Fed: July 2011 Business Outlook Survey "The survey’s broadest measure of manufacturing conditions, the diffusion index of current activity, increased to 3.2 from -7.7 [any reading above zero is expansion]."
Here is a graph comparing the regional Fed surveys and the ISM manufacturing index. The dashed green line is an average of the NY Fed (Empire State) and Philly Fed surveys through July. The ISM and total Fed surveys are through June.
The averaged Empire State and Philly Fed surveys are back close to zero combined. July was a little better than June for both surveys.
• Other Economic Stories ...
• NAHB Builder Confidence index increases in July, Still Depressed
• On Track for Record Low Housing Completions in 2011
• Multi-family Starts and Completions
• NY Fed's Brian Sack: The SOMA Portfolio at $2.654 Trillion
Have a great weekend!
Unofficial Problem Bank list declines to 993 Institutions
by Calculated Risk on 7/23/2011 08:15:00 AM
Note: this is an unofficial list of Problem Banks compiled only from public sources.
Here is the unofficial problem bank list for July 22, 2011.
Changes and comments from surferdude808:
This week there were four removals and two additions to the Unofficial Problem Bank List. These changes result in the list having 993 institutions with $415.7 billion in assets, down from 995 institutions with assets of $$416.2 last week.
Failure remains the most likely way to exit the list. Leaving via failure this week were Bank of Choice, Greeley, CO ($1.1 billion); LandMark Bank of Florida, Sarasota, FL ($275 million); and SouthShore Community Bank, Apollo Beach, FL ($46 million Ticker: SSHC). The other removal was an action termination against Alterra Bank (f/k/a 1st Financial Bank), Overland Park, KS ($133 million).
The two additions were Liberty Bank, F.S.B., West Des Moines, IA ($1.0 billion) and Columbia Savings and Loan Association, Milwaukee, WI ($23 million).
Next week, we anticipate the FDIC will release its actions for June 2011.
Friday, July 22, 2011
Reports: Government considering renting REOs, Extending Conforming Loan Limits
by Calculated Risk on 7/22/2011 09:30:00 PM
From Nick Timiraos at the WSJ: Government Considers Ways to Rent Foreclosed Homes
The Obama administration is examining ways to pull foreclosed properties off the market and rent them to help stabilize the housing market, according to people familiar with the matter.I'll have some comments on this over the weekend.
While the plans may not advance beyond the concept phase, they are under serious consideration by senior administration officials because rents are rising even as home prices in many hard-hit markets continue to fall due to high foreclosure levels.
And from Jon Prior at HousingWire: White House to tackle housing reform after debt ceiling fight
A spokesperson for Rep. Barney Frank (D-Mass.) told HousingWire Friday the Obama administration has begun work on a proposal to extend the conforming loan limits, which are set to expire in October. ... Rep. John Campbell (R-Calif.) and Rep. Gary Ackerman (D-N.Y.) introduced a bill last week that would extend the elevated loan limits for another two years.Campbell represents a district in Orange County that will probably be impacted by the lower conforming limits.
Note: Here is a Spreadsheet with the current loan limits and the new loan limits by area (sorted by largest change in limit).
Bank Failure #58: Bank of Choice, Greeley, Colorado
by Calculated Risk on 7/22/2011 07:11:00 PM
Governments way, or highway
Free will delusion
by Soylent Green is People
From the FDIC: Bank Midwest, National Association, Kansas City, Missouri, Assumes All of the Deposits of Bank of Choice, Greeley, Colorado
As of March 31, 2011, Bank of Choice had approximately $1.07 billion in total assets and $924.9 million in total deposits. ... The FDIC estimates that the cost to the Deposit Insurance Fund (DIF) will be $213.6 million. ... Bank of Choice is the 58th FDIC-insured institution to fail in the nation this year, and the fifth in Colorado.I guess they had no choice.


