by Calculated Risk on 2/18/2011 08:16:00 PM
Friday, February 18, 2011
Bank Failure #21 for 2011: Charter Oak Bank, Napa, California
Harvested by reapers scythe
Charter Oaks corked
by Soylent Green is People
From the FDIC: Bank of Marin, Novato, California, Assumes All of the Deposits of Charter Oak Bank, Napa, California
As of December 31, 2010, Charter Oak Bank had approximately $120.8 million in total assets and $105.3 million in total deposits. ... The FDIC estimates that the cost to the Deposit Insurance Fund (DIF) will be $21.8 million. ... Charter Oak Bank is the twenty-first FDIC-insured institution to fail in the nation this year, and the second in California.That makes three today.
Bank Failure #20 in 2011: Effingham, Springfield, Georgia
by Calculated Risk on 2/18/2011 06:06:00 PM
Springfield Citizen's failure
That's one Effed up bank.
by Soylent Green is People
From the FDIC: HeritageBank of the South, Albany, Georgia, Assumes All of the Deposits of Citizens Bank of Effingham, Springfield, Georgia
As of December 31, 2010, Citizens Bank of Effingham had approximately $214.3 million in total assets and $206.5 million in total deposits. ... The FDIC estimates that the cost to the Deposit Insurance Fund (DIF) will be $59.4 million. ... Citizens Bank of Effingham is the twentieth FDIC-insured institution to fail in the nation this year, and the sixth in Georgia.Georgia on my mind.
Bank Failure #19 in 2011: Habersham Bank, Clarkesville, Georgia
by Calculated Risk on 2/18/2011 05:13:00 PM
Leaving from the station
Bair: Oh, no, no no
by Soylent Green is People (Apologies to The Monkees)
From the FDIC: SCBT National Association, Orangeburg, South Carolina, Assumes All of the Deposits of Habersham Bank, Clarkesville, Georgia
As of December 31, 2010, Habersham Bank had approximately $387.6 million in total assets and $339.9 million in total deposits. ... The FDIC estimates that the cost to the Deposit Insurance Fund (DIF) will be $90.3 million. ... Habersham Bank is the nineteenth FDIC-insured institution to fail in the nation this year, and the fifth in Georgia.Georgia again ...
Residential Remodeling Index
by Calculated Risk on 2/18/2011 02:54:00 PM
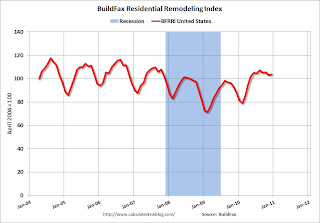
Diana Olick at CNBC mentioned a remodeling index from BuildFax this week:
A remodeling index from Texas-based BuildFax shows a national surge in remodeling work toward the end of the year, which appears to be continuing now.It seem to me that requires a graph!
 Click on graph for larger image in graph gallery.
The BuildFax Residential Remodeling Index is based on the number of properties pulling residential construction permits in a given month.
Sure enough - as Diana Olick noted - there has been a "surge in remodeling work" with November close to the levels of 2004 through 2006, and the strongest December since BuildFax started the index in 2004.
Note: permits are not adjusted by value, so this doesn't mean there is more money being spent, just more permit activity. Also some smaller remodeling projects are done without permits and the index will miss that activity.
Data Source: BuildFax, Courtesy of Index.BuildFax.com
Europe Update
by Calculated Risk on 2/18/2011 12:34:00 PM
A few notes and stories ...
• Portugal bond yields are soaring with the 10-year near 7.5%. There is growing speculation that Portugal will be the third European country (after Greece and Ireland), to require a bailout.
• The last European meeting failed to reach a consensus on a resolution mechanism. There is a meeting of several EU leaders, apparently including Angela Merkel and Nicolas Sarkozy, in Helsinki on March 4th, and then a special eurozone debt crisis summit on March 11th. (A Portugal bailout might be high on the agenda by then - especially since Portugal has large funding needs in April).
• The Irish election is on February 25th.
• From Reuters: ECB borrowing spike intensifies bank speculation
Emergency borrowing from the European Central Bank remained exceptionally elevated for a second straight day on Friday, intensifying speculation that one or more euro zone bank might be facing new funding problems.• From the NY Times: Spain Gives Savings Banks Six More Months to List Equity
• Here are the Ten Year yields for Spain, Ireland and Greece (mostly moving sideways other than Portugal, although Ireland seems to be drifting up too).
LA Port Traffic in January
by Calculated Risk on 2/18/2011 10:24:00 AM
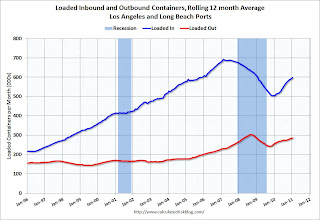
The first graph shows the rolling 12 month average of loaded inbound and outbound traffic at the ports of Los Angeles and Long Beach in TEUs (TEUs: 20-foot equivalent units or 20-foot-long cargo container). Although containers tell us nothing about value, container traffic does give us an idea of the volume of goods being exported and imported - and possible hints about the trade report for January. LA area ports handle about 40% of the nation's container port traffic.
 Click on graph for larger image in graph gallery.
To remove the strong seasonal component for inbound traffic, this graph shows the rolling 12 month average.
On a rolling 12 month basis, inbound traffic is up 18% and outbound up 11%.
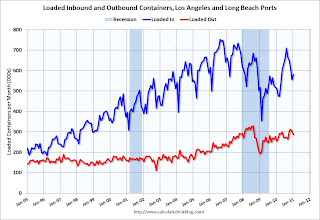
 The 2nd graph is the monthly data (with strong seasonal pattern).
For the month of January, loaded inbound traffic was up 13% compared to January 2010, and loaded outbound traffic was up 12% compared to January 2010 - but down compared to December 2010. This suggests the trade deficit with China (and other Asians countries) probably increased in January.
Bernanke on Global Imbalances
by Calculated Risk on 2/18/2011 08:44:00 AM
Fed Chairman Ben Bernanke argued this morning that the Fed is not to blame for inflation in other countries, and that those countries have tools to fight inflation ("including exchange rate adjustment, monetary and fiscal policies, and macroprudential measures"). He also argued the global imbalances are back, and countries "need to allow exchange rates to better reflect market fundamentals" and increase domestic demand (probably aimed at China).
From Fed Chairman Ben Bernanke: Global Imbalances: Links to Economic and Financial Stability. Excerpt:
In light of the relatively muted recoveries to date in the advanced economies, the central banks of those economies have generally continued accommodative monetary policies. Some observers, while acknowledging that an aborted recovery in the advanced economies would be highly detrimental to the emerging market economies, have nevertheless argued that these monetary policies are generating negative spillovers. In particular, concerns have centered on the strength of private capital flows to many emerging market economies, which, depending on their policy responses, could put upward pressure on their currencies, boost their inflation rates, or lead to asset price bubbles.
... policymakers in the emerging markets have a range of powerful--although admittedly imperfect--tools that they can use to manage their economies and prevent overheating, including exchange rate adjustment, monetary and fiscal policies, and macroprudential measures. ... it should be borne in mind that spillovers can go both ways. For example, resurgent demand in the emerging markets has contributed significantly to the sharp recent run-up in global commodity prices. More generally, the maintenance of undervalued currencies by some countries has contributed to a pattern of global spending that is unbalanced and unsustainable.
...
To achieve a more balanced international system over time, countries with excessive and unsustainable trade surpluses will need to allow their exchange rates to better reflect market fundamentals and increase their efforts to substitute domestic demand for exports. At the same time, countries with large, persistent trade deficits must find ways to increase national saving, including putting fiscal policies on a more sustainable trajectory
Thursday, February 17, 2011
OCC's Walsh on Foreclosure Issues and MERS
by Calculated Risk on 2/17/2011 11:04:00 PM
An update ... acting Comptroller of the Currency John Walsh commented on the mortgage servicer and MERS reviews today. There are two documents: written and oral testimony.
From the written testimony:
Following reports of irregularities in the foreclosure processes of several major mortgage servicers in the latter part of 2010, the OCC, together with the FRB, the FDIC, and the OTS, undertook an unprecedented project of coordinated horizontal examinations of foreclosure processing at the 14 largest federally regulated mortgage servicers during fourth quarter 2010. In addition, the agencies conducted interagency examinations of MERSCORP and its wholly owned subsidiary, Mortgage Electronic Registration Systems, Inc. (MERS), and Lender Processing Servicers (LPS), which provide significant services to support mortgage servicing and foreclosure processing across the industry. The primary objective of the examinations was to evaluate the adequacy of controls and governance over bank foreclosure processes, including compliance with applicable federal and state law. ...There is a list of some of the objectives for uniform standards starting on page 16 of the written testimony.
From the oral testimony:
We are now finalizing remedial requirements and sanctions appropriate to remedy comprehensively the problems identified. Our actions will address identified deficiencies and will hold servicers to standards that require effective and proactive risk management, and appropriate remedies for customers who have been financially harmed. We are also discussing our supervisory actions with other Federal agencies and state Attorneys General with a view toward resolving comprehensively and finally the full range of legal claims arising from the mortgage crisis.It sounds like one of the clear goals of the servicer and MERS reviews is to resolve "comprehensively and finally the full range of legal claims arising from the mortgage crisis".
Equally important, we are drawing on lessons from these examinations to develop mortgage servicing standards for the entire industry. The OCC developed a framework of standards that we shared with other agencies, and we are now participating in an interagency process to establish nationwide requirements that are comprehensive, apply to all servicers, provide the same safeguards for all consumers, and are directly enforceable by the agencies. While we are still at a relatively early stage, we share the common objective to achieve significant reform in mortgage servicing practices.
The NAR Reponds to Questions of Overstating Sales
by Calculated Risk on 2/17/2011 06:09:00 PM
The National Association of Realtors (NAR) responded today to recent stories about the NAR overstating sales. This was in response to Calculated Risk posts in January (here, here and here), and to CoreLogic's release on Tuesday. Barry Ritholtz picked up on the story this morning.
From the NAR: Existing Home Sales: Benchmarking FAQ
Home sales measurements have shown to differ at times as reported by NAR and some outside organizations. Here are the facts and background you need to know.So the revisions should come this summer. I expect the NAR to revise down sales for the last 4 or 5 years, with significant downward revisions for 2009 and 2010 (CoreLogic estimated 15% to 20%).
How are NAR home sales computed?
NAR collects sales data from numerous MLSs, with a reporting sample of about 40 percent. If data computes to be a 5 percent increase from one year ago then we say home sales rose 5 percent from one year ago.
What about 5 million home sales? An increase of 5 percent is understood, but how is 5 or 6 million home sales computed?
A base figure is used from Census 2000 where one can compute how many homes were bought. If you recall there was a long-form of Census which asked questions about whether you moved or not and whether or not you bought a home. Based on this, one knows that 5.2 million existing homes were sold in 2000. Note that this benchmarking process does not use any data from MLSs. Hence, it is considered clean. With this base figure, we then apply the percent changes to sales obtained from MLSs. So if MLSs data addition says a 5 percent increase then we would say there were 5.4 million home sales.
How can NAR sales data drift away from true measure?
It is not definitive if NAR data has a measurable drift other than normal small statistical noise that may arise from not using all MLSs and from any data entry error or local MLSs sending wrong data to NAR. In statistics, one just assumes the positive and negative noises cancel each other out. It is however possible for this statistical noise to drift mostly in one direction and hence cumulatively add up over many years. In our last benchmark in year 2000, we found the reported home sales had a 13 percent upward drift compared to what Census data implied. NAR then revised the past 1990s data to match up with the Census data.
How are other home sales data computed?
Most other data comes from courthouse recordings. Generally, they make some assumptions about noncovered areas. Because of improved electronic recordings, they claim to capture more data and more quickly than in the past.
When will the new benchmarking take place?
A: In 2010 Census, a long-form questionnaire was not used. Therefore, the Census no longer asked about whether people moved and bought a home. So another brand new benchmarking process is needed. NAR has already been in contact with all key housing economists in the industry and government agencies and a few in the academia about finding a new benchmarking process. We expect a new clean, agreed-upon benchmark figure by the summer of this year.
In addition, we will be determining a new way to re-benchmark on a more frequent basis, possibly annually, to lessen any drift that can accumulate over time. This frequent re-benchmarking, rather than waiting every 10 years, is needed since the Census no longer collects a long-form questionnaire. With benchmarking, we will be working with various outside housing economists to develop a new-agreed upon method.
Hotel Occupancy Rate: Hotels Struggling in 2011
by Calculated Risk on 2/17/2011 03:14:00 PM
This year has been tough for hotel occupancy, with only a small increase over the very low levels for the same period a year ago. Here is the weekly update on hotels from HotelNewsNow.com: Midscale segment reports weekly decreases
Overall, the U.S. hotel industry’s occupancy increased 1.7% to 54.7%, ADR was up 0.7% to US$97.88, and RevPAR finished the week up 2.4% to US$53.51.The following graph shows the four week moving average of the occupancy rate as a percent of the median occupancy rate from 2000 through 2007.
 Click on graph for larger image in graph gallery.
Note: Since this is the percent of the median from 2000 to 2007, the percent can be greater than 100%.
The down spike in 2001 was due to 9/11. The up spike in late 2005 was hurricane related (Katrina and Rita). The dashed line is the current level.
This shows how deep the slump was in 2009 compared to the period following the 2001 recession. This also shows the occupancy rate improvement has slowed sharply since the beginning of the year (about 90% of the median from 2000 to 2007).
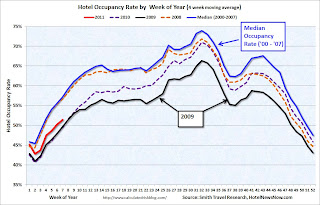
 And here is the "spider" graph showing the seasonal pattern for the hotel occupancy rate.
The occupancy rate really fell off a cliff in the 2nd half of 2008, and then 2009 was the worst year for the occupancy rate since the Great Depression. The occupancy rate started to improve in the Spring of 2010, and was above the 2008 rates later in the year.
However, so far, 2011 is closer to the weak occupancy rates of 2009 and early 2010 than to the median for 2000 through 2007.
Blame it on the snow ... but if the occupancy rate doesn't pick up soon, Smith Travel will be reporting year-over-year declines in the occupancy rate again.
Data Source: Smith Travel Research, Courtesy of HotelNewsNow.com


